







Shashwati Khuas
Department of Business Administration,
Sambalpur University, Jyotivihar, Burla.
khuasshashwati@gmail.com
Dr. Anuradha Samal
Assistant Professor,
Department of Business Administration,
Sambalpur University, Jyotivihar, Burla.
Gourav Kumar Panda
Research Scholar,
Department of Business Administration,
Sambalpur University, Jyotivihar, Burla.
Abstract:
This paper presents a comparative analysis of the NIFTY 100 and NIFTY 100 ESG
indices, shedding light on the profound impact of Environmental, Social, and Governance
(ESG) criteria within investment strategies, particularly in the context of emerging
markets such as India. The study examines how the integration of ESG principles can
substantially influence the risk-return profile of portfolios and contribute to their stability.
The NIFTY 100 ESG index, designed to prioritize sustainable investing principles,
emerges as a standout performer when contrasted with the traditional NIFTY 100 index.
Notably, the former consistently exhibits more stable performance with lower volatility,
even during times of economic uncertainty. This resilience suggests that ESG factors can
act as a safeguard against market volatilities, providing investors with a cushion during
turbulent times. The findings of this study hold critical implications for investors and
policymakers alike. It underscores the potential of ESG-focused investments to align with
ethical and sustainable objectives while simultaneously delivering competitive financial
returns. The growing prominence of ESG considerations within the financial sector is
highlighted, emphasizing their pivotal role in shaping the future landscape of investment strategies.
This research contributes significantly to our broader understanding of how sustainable
investing can seamlessly integrate into mainstream investment portfolios. It demonstrates
the feasibility of striking a harmonious balance between ethical considerations and
financial performance, particularly within the dynamic and burgeoning markets of India.
In a world increasingly conscious of environmental and social responsibilities, this
comparative study serves as a beacon for investors seeking opportunities that resonate
with their values. It underscores the transformative power of ESG criteria, not only as a
driver of ethical investing but also as a cornerstone of sound financial decision-making in
the ever-evolving global investment landscape.
Keywords: ESG Criteria, NIFTY 100, NIFTY 100 ESG, Sustainable Investing
Introduction:
In the realm of financial markets, the study of volatility and returns has long been a focal point
for investors, analysts, and researchers alike (Clive W.J Graner and Ser-Huang Poon, 2001).
These two fundamental factors have played a pivotal role in shaping investment decisions,
portfolio management strategies, and the overall assessment of market performance. In the
pursuit of informed investment choices, the analysis of these parameters has provided essential
insights into market behavior and potential risk-reward trade-offs. This study embarked on an
exploration of volatility and returns within the context of two prominent indices: the NIFTY
100 and the NIFTY 100 ESG (Environmental, Social, and Governance) Indices. These indices,
reflecting the dynamics of the Indian stock market, held significant importance in the
investment landscape. While the NIFTY 100 represented a broad and diverse portfolio of
companies, the NIFTY 100 ESG Index incorporated additional criteria related to sustainability
and responsible investing (Jasuja et al. 2021).
The objective of this research was to conduct a comprehensive comparative analysis over time,
shedding light on the historical performance of these indices and their underlying constituents.
By examining the interplay between volatility and returns, patterns, trends, and potential
implications for investors were sought to be discerned. In an era where environmental, social,
and governance factors were increasingly integrated into investment decisions, the NIFTY 100
ESG Index stood as a noteworthy exemplar (GK Sarangi, 2021). The inclusion of ESG criteria
in this index not only reflected a commitment to sustainable investing principles but also introduced an intriguing dimension to the analysis of volatility and returns (Torre, 2020). As
such, this study assessed whether companies with strong ESG credentials exhibited distinct
patterns in terms of risk and reward compared to their counterparts in the broader NIFTY 100
(R.Raju, 2023). To accomplish
this goal, a rigorous methodology was employed, encompassing historical data analysis,
statistical modeling, and econometric techniques. The examination spanned multiple years,
enabling the capture of the evolving market dynamics and the influence of macroeconomic
events on the indices under scrutiny. The findings of this study were expected to provide
valuable insights for investors, asset managers, and policymakers. A deeper understanding of
how these indices had performed over time, in relation to their volatility and returns, could
guide investment strategies, inform risk management decisions, and contribute to the ongoing
discourse on sustainable finance.
Background of the Problem
The realm of financial markets has perpetually been a subject of extensive scrutiny and
analysis. The dynamics of these markets are influenced by numerous factors, with volatility
and returns serving as pivotal metrics in the evaluation of market performance. Volatility, in
particular, represents the degree of price fluctuations in financial instruments, while returns
reflect the gains or losses realized by investors over time. The assessment of volatility and
returns is fundamental not only for individual investors seeking to make informed decisions
but also for institutional investors, asset managers, and policymakers responsible for
overseeing financial stability. In this context, benchmark indices play a crucial role as they
provide a representative snapshot of market performance and serve as a basis for measuring
investment returns. One such prominent benchmark in the Indian financial landscape is the
NIFTY 100 Index, which encompasses a diversified portfolio of 100 of the largest and most
liquid stocks listed on the National Stock Exchange (NSE). It is widely used as a reference
point by market participants to gauge the performance of the Indian equity market as a whole.
However, the financial landscape has evolved, and investors have increasingly recognized the
importance of environmental, social, and governance (ESG) factors in their investment
decisions. The NIFTY 100 ESG Index represents an innovative development in this regard. It
incorporates ESG criteria, reflecting a commitment to sustainable investing principles. This
index goes beyond the traditional focus on financial metrics and includes companies that meet certain sustainability and responsible business criteria.
This study arises from the evolving landscape of investment choices and the growing emphasis
on sustainable finance. It seeks to address several critical questions:
- How has the NIFTY 100 Index historically performed in terms of volatility and
returns? - What are the historical patterns and trends in the volatility and returns of the
NIFTY 100 Index over time? - How does the NIFTY 100 ESG Index compare to the NIFTY 100 Index in terms of
volatility and returns? - Are there discernible differences in the risk-return profiles of these two indices?
- To what extent do ESG criteria influence the performance of companies included
in the NIFTY 100 ESG Index, and how does this impact volatility and returns?
By delving into these questions, this research aims to provide a comprehensive understanding
of how volatility and returns have evolved in the Indian equity market, as well as how
sustainability criteria can affect the performance of benchmark indices. The findings of this
study can serve as a valuable resource for investors, asset managers, and policymakers seeking
to navigate the complex terrain of modern financial markets while incorporating sustainability
considerations into their decision-making processes.
3. Research Objectives
The primary objectives of this study are to analyze and compare the historical volatility and
returns of the NIFTY 100 and NIFTY 100 ESG Indices, elucidate the patterns and trends in
their performance over time, and investigate the potential influence of environmental, social,
and governance (ESG) criteria on the risk-return profiles of constituent companies.
Specifically, we aim to (1) assess the historical performance of the NIFTY 100 Index in terms
of volatility and returns, (2) examine how volatility and returns of the NIFTY 100 Index have
evolved over a specified time period, (3) compare the volatility and returns of the NIFTY 100
ESG Index to those of the NIFTY 100 Index to discern potential differences in their risk- return
dynamics, and (4) explore the relationship between ESG criteria compliance and the volatility
and returns of companies included in the NIFTY 100 ESG Index. Through these objectives, we
seek to provide valuable insights into the interplay of financial performance and sustainability considerations within the context of benchmark indices in the Indian equity market.
4. Literature Review
A comprehensive examination of the relationship between Environmental, Social, and
Governance (ESG) criteria and corporate financial performance has been a subject of interest
in recent years. Friede et al. (2015) conducted an extensive review of over 2000 empirical
studies, revealing a robust empirical foundation supporting the business case for ESG
investing. Their analysis showed that approximately 90% of the studies demonstrated a
nonnegative relationship between ESG factors and corporate financial performance, with the
majority reporting positive outcomes. This positive impact of ESG on financial performance
was found to remain stable over time and across various factors, including portfolio and non-
portfolio studies, regions, and diverse asset classes. In a related context, studies have explored
the performance of benchmark indices that incorporate ESG principles.
Bathla (2015) conducted a study comparing the performance of Nifty 100 and Nifty 100 ESG
over a five-year period. The findings indicated that Nifty 100 ESG provided more consistent
returns, suggesting that investments aligned with environmentally friendly, socially
responsible, and ethical firms yielded less volatile returns. Further insights into the impact of
ESG considerations on financial performance were gained through Jain et al.’s (2023)
examination of ESG indices in India. Utilizing performance metrics such as the Capital Asset
Pricing Model (CAPM), Sharpe ratio, and Treynor ratio, the study consistently found that ESG
indices outperformed conventional indices, offering more favorable risk-adjusted returns. The
analysis extended to the performance of socially responsible stock portfolios in the Indian
market, as explored by Tripathi and Bhandari (2015). Their study revealed that these portfolios
exhibited lower relative risk despite higher systematic risk. During market crises, socially
responsible stocks generated significantly higher returns compared to other portfolios,
emphasizing the potential benefits of integrating ESG principles into investment strategies. The
influence of sustainability indices on benchmark indices was examined by Kishan and R.
Gayathri (2020). Their comparative study of sustainability reporting practices indicated that
products focused on sustainability had a significant impact on the performance of benchmark
indices like SENSEX and NIFTY 50.
In contrast, Jain et al. (2019) found no significant performance difference between sustainable
and conventional indices in their study comparing Thomson Reuters/S-Network global ESG indices and traditional MSCI indices. This suggested that sustainable investments may serve as
viable substitutes without compromising financial returns. The changing landscape of market
efficiency amid external events was explored by Usha Kiran and Tadoori (2022), who
calculated the Hurst exponent for NSE indices. Their findings suggested that ESG indices
exhibited higher efficiency in the post-Covid period, reflecting a shift in investor preferences
toward ESG investments in response to the pandemic. Velte (2017) delved into the impact of
ESG performance on financial performance in Germany. His analysis revealed a positive
relationship between ESG performance and return on assets, suggesting that companies with
stronger ESG performance tended to achieve higher returns on their assets. The role of ESG
achievements in brand valuation was investigated by Lee et al. (2021). They found that certain
ESG achievements, such as emissions performance and employee satisfaction, played a
significant role in shaping consumer perceptions of brand valuation, particularly in the
automotive industry.
Wong & Zhang (2022) explored the impact of ESG ratings on Malaysian firms’ value and
discovered a potential positive relationship between ESG inclusion and firm value. This was
evidenced by a decrease in the cost of capital and an increase in Tobin’s Q post-ESG inclusion.
In Asia, Melinda and Wardhani (2020) examined the effect of ESG performance on firm value.
Their research indicated that better ESG performance positively impacted firm value across
various dimensions, underscoring the strategic importance of effective CSR and ESG
management for enhancing corporate values. Kim and Li (2021) conducted a comprehensive
review of empirical studies, aggregating results to investigate the impact of ESG factors on
corporate finance. The consistent positive relationship between ESG factors and corporate
financial performance emerged as a key finding. Giese et al. (2019) explored the economic
reasons behind the positive risk and performance results associated with ESG indexes, using
existing corporate finance models. Their analysis highlighted the multi- channel process
through which ESG affected company valuation and performance.
Lastly, Aldieri et al. (2023) examined the link between ESG ratings and the risk market
performance of listed firms, specifically the top 25 constituents of the S&P500 index. Their
findings did not show a clear correlation between higher ESG scores and superior financial
performance, indicating the complex nature of this relationship. Tiwari et al. (2022) provided
an overview of the ESG investing landscape in India and explored the performance of Nifty
ESG 100 compared to the benchmark index of Nifty 50. Their findings suggested that ESG investments provided better returns irrespective of market sentiments, making them a
recommended choice for retail investors to outperform the benchmark.
5. Methodology
This research undertakes a comparative analysis of the “NIFTY 100” and “NIFTY 100 ESG”
indices, leveraging historical data sourced from the National Stock Exchange (NSE). The
methodology encompasses a series of data preprocessing and analysis steps to facilitate a
comprehensive examination of these indices. The initial phase involved meticulous data
preparation, with a focus on rectifying inconsistencies in date formatting and addressing
missing data points. This critical step ensured the quality and integrity of the dataset. For data
manipulation and transformation tasks, R-Studio (version 4.3.2) was employed, providing a
robust platform for efficient data handling.
To facilitate a visual comparison of the performance and volatility of the two indices over the
specified analysis period, various visualization tools were harnessed. Specifically, ggplot and
ggplot2, renowned for their versatility and effectiveness, were utilized for plotting daily returns and
30-day rolling standard deviations for both the “NIFTY 100” and “NIFTY 100 ESG” indices.
These visualizations aimed to highlight trends, similarities, and differences in returns and
volatility, thereby offering valuable insights into the risk and return profiles of the two indices.
Additionally, MS-Excel played a pivotal role in this study by enabling the calculation and
presentation of the correlation between the “NIFTY 100” and “NIFTY 100 ESG” indices. This
correlation analysis served to elucidate the degree of association between the two indices,
providing further context to the comparative analysis.
It is imperative to acknowledge that the findings of this study are subject to the inherent
limitations of the data utilized and the methodologies employed. Careful consideration of these
limitations is essential for a comprehensive interpretation of the research outcomes, as they
may impact the generalizability and applicability of the findings within the broader financial context.
6. Analysis &Findings
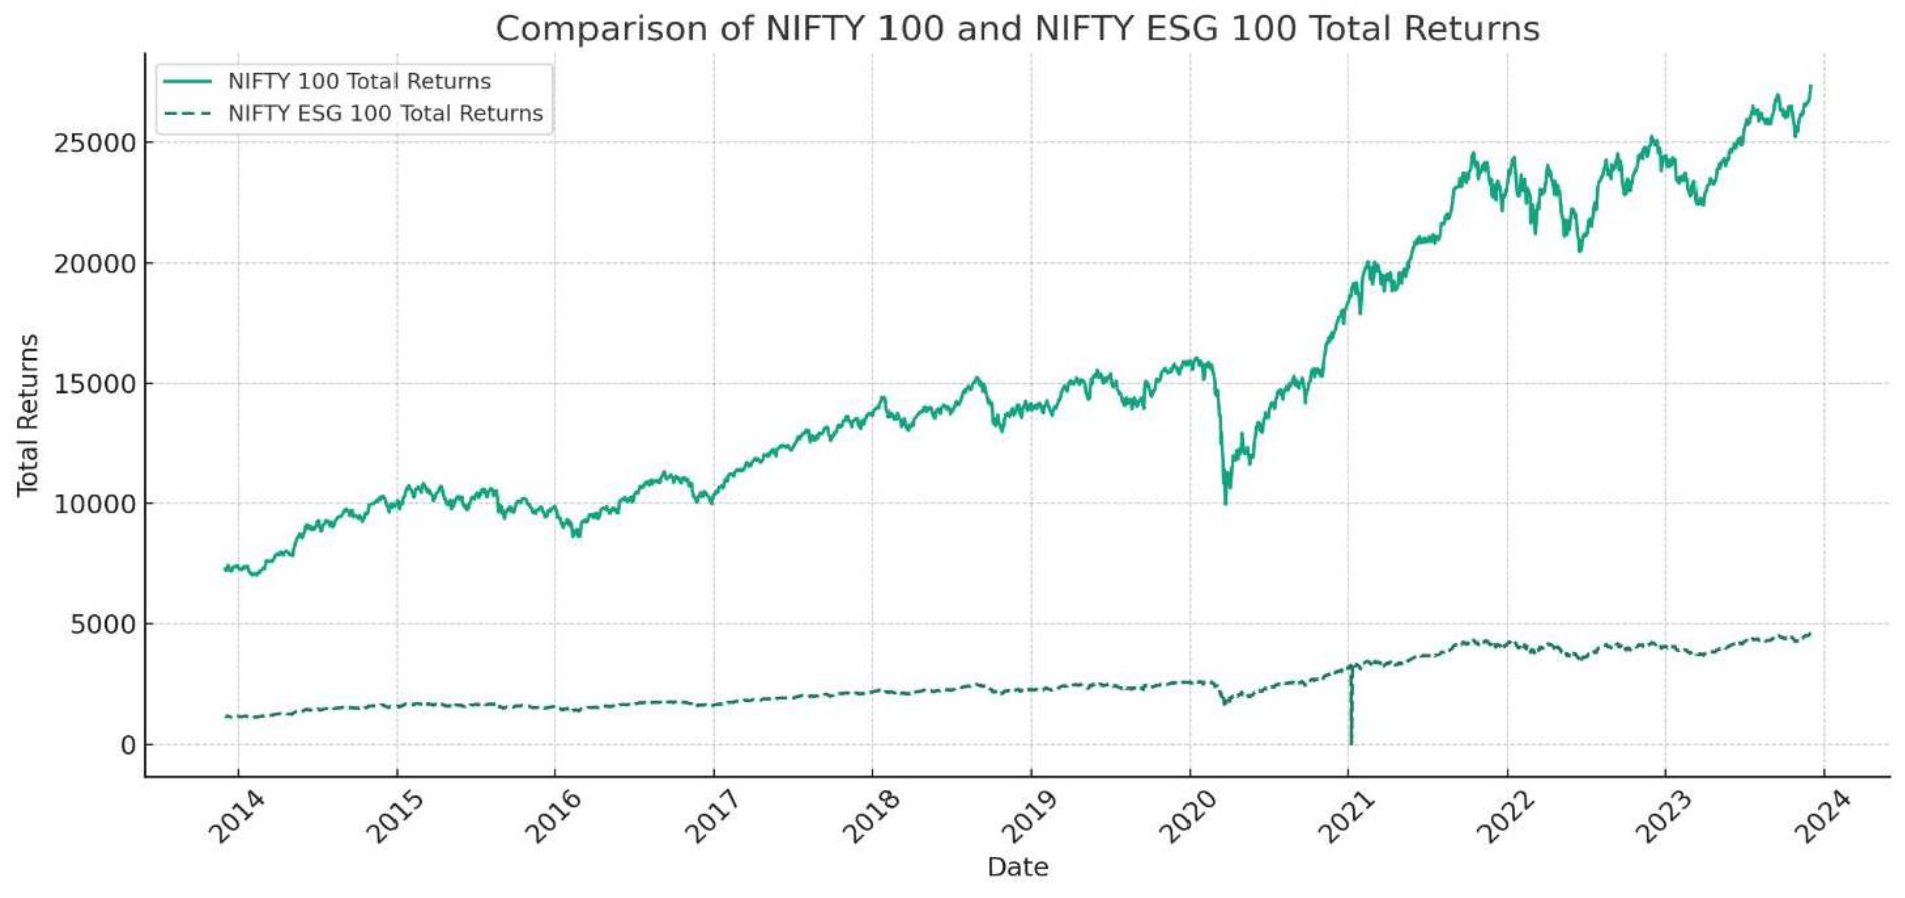
Trend Analysis:
The “NIFTY 100 Total Returns” and “NIFTY ESG 100 Total Returns” exhibit parallel trends
across the specified time frame, suggesting a degree of influence by similar market dynamics.
Nevertheless, distinctions arise in the amplitude of fluctuations, with the NIFTY 100 displaying
more pronounced oscillations in total returns when compared to the NIFTY ESG 100.
Volatility Analysis:
Notably, the NIFTY 100 manifests a higher level of volatility, marked by sharper ascents
and descents. This heightened volatility implies a potentially greater risk profile inherent
to the NIFTY 100, as opposed to the NIFTY ESG 100. In contrast, the NIFTY ESG
fluctuations but follows a relatively steadier trajectory. This characteristic may suggest a
more conservative or diversified investment strategy, aligning with the principles of ESG
(Environmental, Social and Governance) focused funds.
Recent Performance Review:
In the dataset’s later dates, a discernible dip becomes apparent in the NIFTY 100’s
performance. This observation could raise concerns among short-term investors, yet it
might also present an attractive buying opportunity for those with a long-term investment
horizon. Meanwhile, the NIFTY ESG 100, though influenced by market conditions, exhibits a less dramatic downturn in the same period. This comparatively milder decline
may appeal to investors with a lower risk tolerance.
Market Dynamics:
Given the analogous trends observed in both indices, it is reasonable to infer that
overarching market conditions, including economic factors, policy changes, and global
events, exert a substantial influence on both the NIFTY 100 and the NIFTY ESG 100.
Investment Implications:
For investors prioritizing sustainability and seeking reduced risk exposure, the NIFTY
ESG 100 presents a more enticing option. Conversely, individuals in pursuit of potentially
higher returns and who are willing to embrace elevated risk levels may find the NIFTY
100 to be a more suitable choice.
Data Comparison:
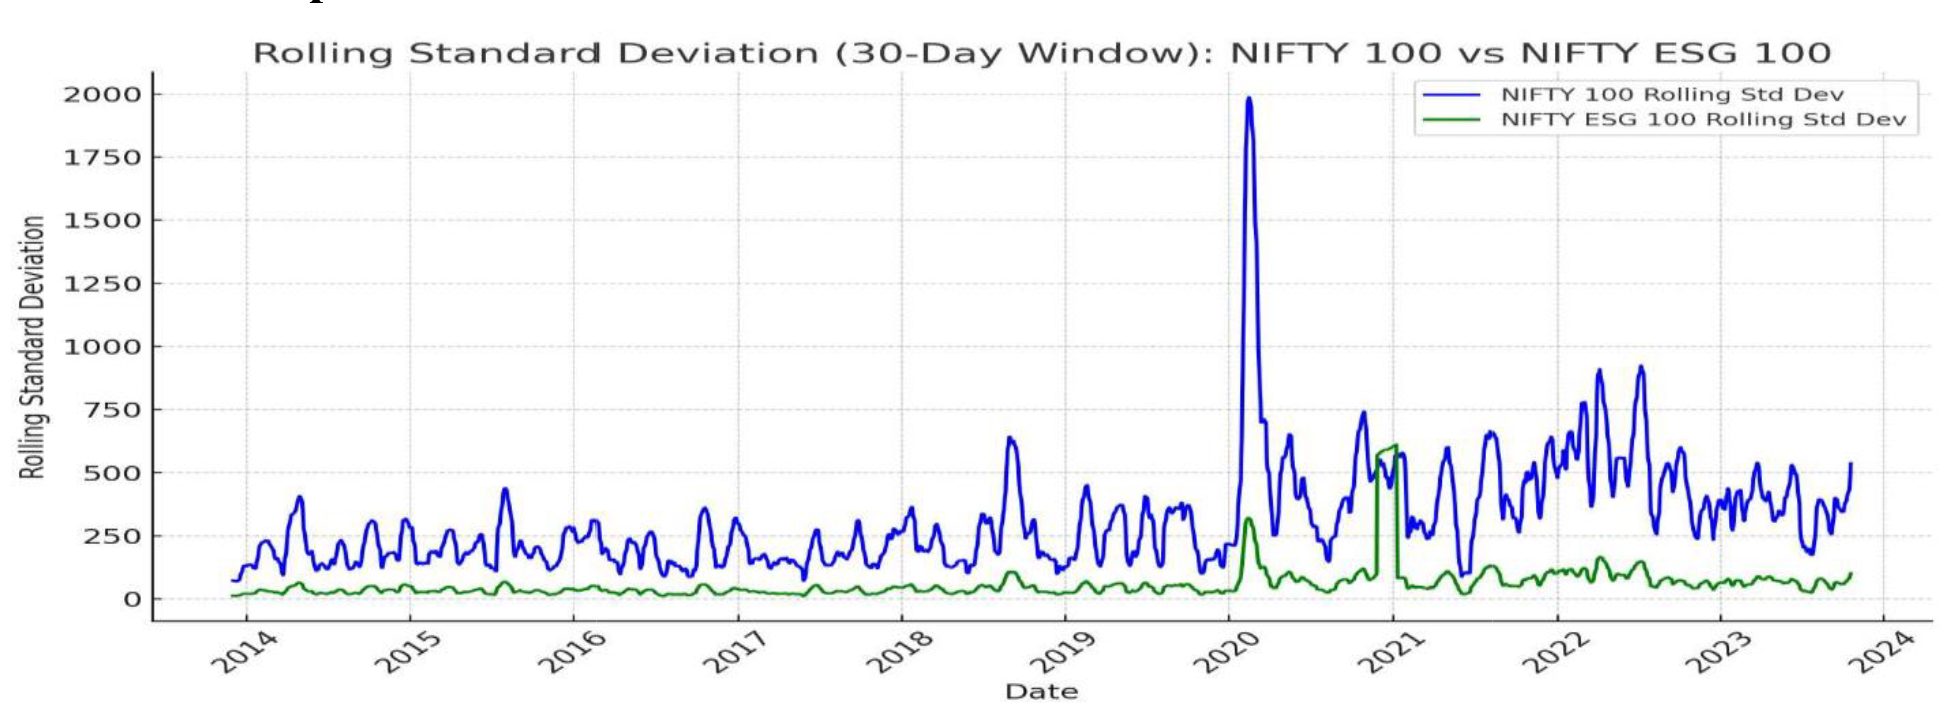
NIFTY 100 Total Returns: The standard deviation stands at approximately 5544.41.
NIFTY ESG 100 Total Returns: The standard deviation is approximately 998.99.
The NIFTY 100 exhibits a significantly greater standard deviation when compared to the
NIFTY ESG 100. This observation signifies that the returns associated with the NIFTY 100
display a more extensive range of variability or dispersion. Put simply, investing in the NIFTY
100 may entail a higher degree of fluctuations in returns.
Conversely, the NIFTY ESG 100, characterized by its lower standard deviation, suggests a
higher degree of consistency and reduced variability in returns. This implies a potentially more
stable investment experience with fewer unexpected fluctuations
In the realm of investment, a heightened standard deviation often corresponds to increased risk,
as it signifies a greater level of unpredictability in returns. Therefore, when evaluated from a
risk perspective, the NIFTY 100 can be regarded as carrying a higher level of risk in
comparison to the NIFTY ESG 100.
Correlation Matrix:
| NIFTY 100 Returns | Date | |
|---|---|---|
| Date | 0.945 | 1 |
| NIFTY 100 Returns | 1 | 0.945 |
Table 6(i): Correlation Table 1
| NIFTY 100 ESG Returns | Date | |
|---|---|---|
| Date | 0.940 | 1 |
| NIFTY 100 ESG Returns | 1 | 0.940 |
Table 6(ii): Correlation Table-2
The correlation coefficient between “NIFTY 100 Total Returns” and the date stands at
approximately 0.945. This indicates a robust positive correlation, signifying that as time
progresses, there is a tendency for “NIFTY 100 Total Returns” to increase. This observation
suggests a prevailing upward trend in the “NIFTY 100” index throughout the data’s time frame.
Similarly, the correlation coefficient between “NIFTY ESG 100 Total Returns” and the date is
approximately 0.940, also denoting a strong positive correlation. This implies that akin to the
“NIFTY 100,” the “NIFTY ESG 100” index exhibits a tendency to rise over time.
Consequently, this correlation underscores a general upward trajectory in the “NIFTY ESG
100” index within the dataset’s specified time period.
For fund managers and investment strategists, these correlation values imply the potential
favorability of a long-term investment approach, especially if the anticipated upward trend is
expected to persist. However, it is crucial for managers to consider diversification despite the
strong correlation with time. Both indices, while displaying similar trends, possess distinct
compositions and may respond differently to market-specific events. Therefore, prudent
investment decisions should account for these distinctions. The notable positive correlation
with time can further be evaluated within the broader context of overall market conditions and
economic indicators, as external factors have the potential to influence and potentially alter the trajectory of these trends.
Average Return Calculation:
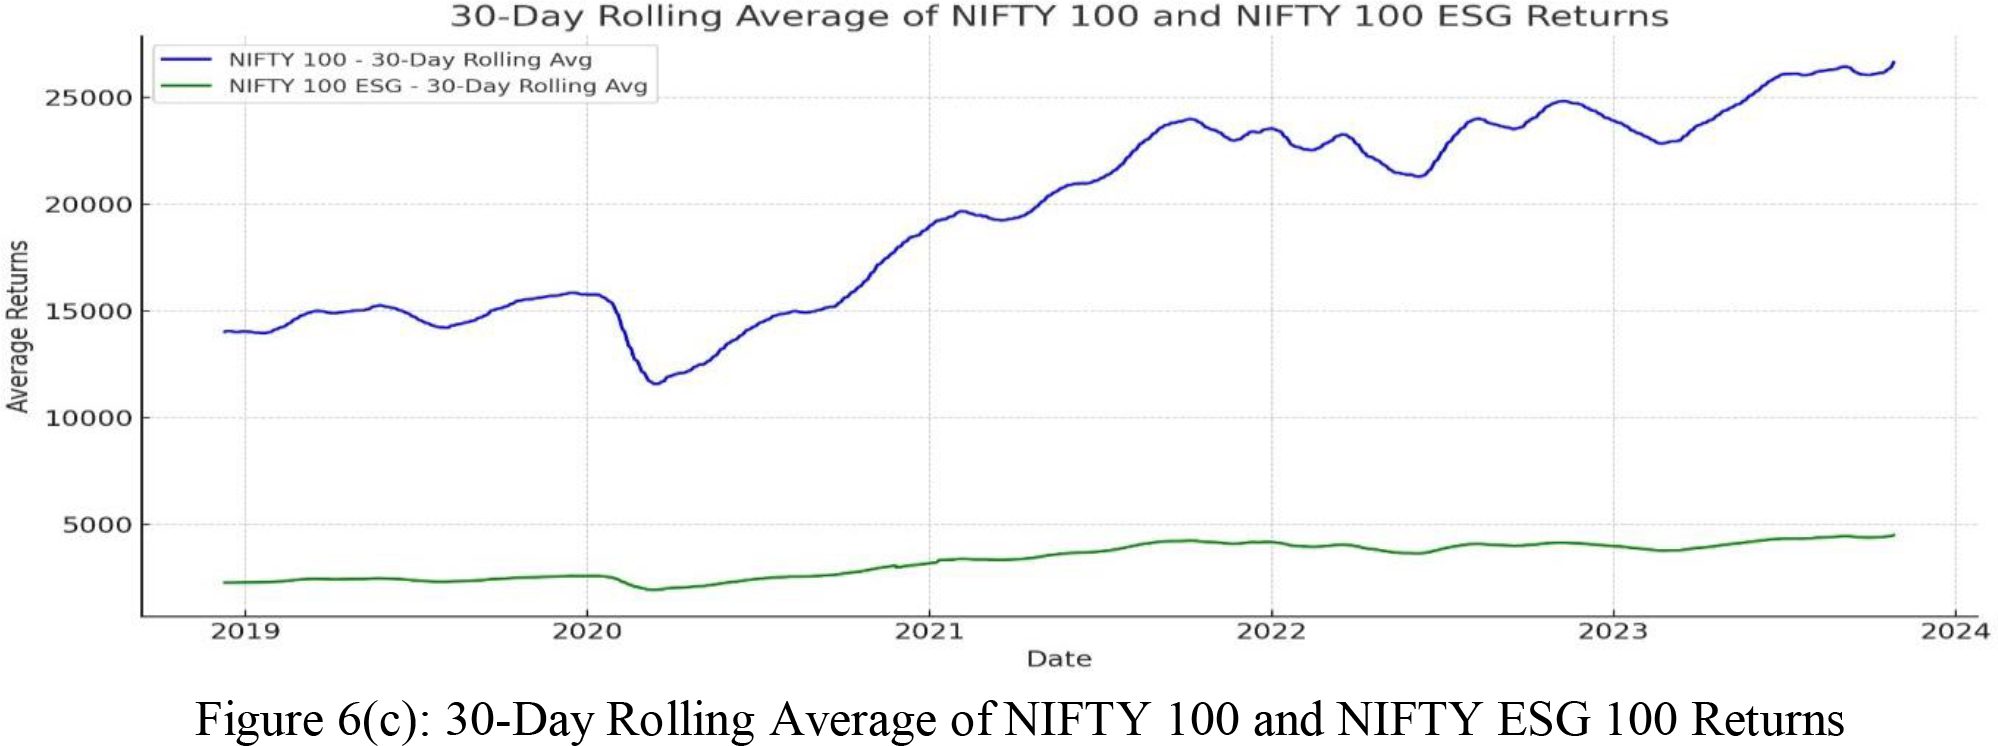
Rolling Average Return: The blue line on the chart represents the rolling average return
of the “NIFTY 100” index. It exhibits an overall upward trajectory, indicating a consistent
increase in the average return of the index over time. While there are occasional
fluctuations, the general trend points towards higher returns, notably pronounced in the
latter part of the chart. Rolling Average Return of “NIFTY 100 ESG”: The green line
corresponds to the rolling average return of the “NIFTY 100 ESG” index. This line also
shows an upward trend, albeit at a more gradual pace compared to the “NIFTY 100.” It
maintains a relatively stable and flat trajectory, suggesting consistent performance with
fewer noticeable fluctuations.
Volatility Analysis: An astute investor would observe that the rolling average return of
the “NIFTY 100” exhibits more pronounced movements, indicative of higher volatility.
This characteristic implies a greater degree of risk but also the potential for higher
rewards. In contrast, the “NIFTY 100 ESG” offers more stable and predictable returns,
making it an appealing choice for risk-averse investors.
Return Potential: The “NIFTY 100” demonstrates significant growth, particularly
noticeable in the chart’s latter segment, which may attract investors seeking growth
opportunities. Stability Consideration: Conversely, “NIFTY 100 ESG,” with its steadier
line, suggests less dramatic growth but also implies lower risk. This stability could be
particularly attractive to long-term investors with a focus on sustainability and a preference for stable returns. Risk Profile: Investors with a high tolerance for risk might
gravitate towards “NIFTY 100” due to its potential for higher returns, notwithstanding the
increased volatility.
Risk Aversion: Conversely, more conservative investors may favor “NIFTY 100 ESG,”
especially if they have an interest in companies adhering to Environmental, Social, and
Governance (ESG) principles, often associated with long-term sustainability. Both indices
exhibit upward trends, but the “NIFTY 100” demonstrates the ability to achieve
substantial growth over time. In contrast, the “NIFTY 100 ESG,” while experiencing
growth, does so at a more modest pace. In summary, this chart offers valuable insights
into the historical performance and volatility of these two indices, aiding investors in
making informed decisions aligned with their investment objectives and risk tolerance.
| Indices | Highest Returns | Lowest Returns |
|---|---|---|
| NIFTY 100 | September 6, 2023 | January 21, 2014 |
| NIFTY 100 ESG | September 7, 2023 | January 6, 2014 |
Test Results:
| Metric | Value | Diagnostic Test | Test Result |
|---|---|---|---|
| R-squared | 0.9901 | Skewness Test (NIFTY 100 Total Returns) | Skew = 0.59139, p-value < 2.2e-16 |
| Coefficients (Intercept) | 1.311e+03 | Skewness Test (NIFTY ESG 100 Total Returns) | Skew = 0.58913, p-value < 2.2e-16 |
| Coefficients (NIFTY ESG 100 Total Returns) | 5.523e+00 | Breusch-Pagan Test | BP = 1.9629, p-value = 0.1612 |
| P-value (Intercept) | <2e-16 | Augmented Dickey-Fuller Test (NIFTY 100 Total Returns) | Dickey- Fuller = -2.3896, p-value = 0.4134 |
| P-value (NIFTY ESG 100 Total Returns) | <2e-16 | Augmented Dickey-Fuller Test (NIFTY ESG 100 Total Returns) | Dickey- Fuller = -1.9827, p-value = 0.5856 |
To examine the relationship between NIFTY 100 Total Returns and NIFTY 100 ESG Total
Returns, a linear regression model is employed. Within the “Coefficients” section, two
values are presented: the Intercept (which denotes a starting point when ESG returns are
zero) and the slope for ESG returns. Both of these values demonstrate high significance,
indicating a robust and dependable relationship. The “Residuals” highlight some data
variations, encompassing disparities ranging from -1327.7 to 17500.1. The overall reliability
of the data from this regression analysis appears to be substantial.
The model reveals an exceptionally strong association between NIFTY 100 Total Returns
and NIFTY ESG 100 Total Returns, as underscored by a notable R-squared value of 0.9901
(equivalent to 99%). This suggests that the model accounts for a substantial portion of the
variability in NIFTY 100 returns based on ESG 100 returns. The statistical significance (p-
value < 2e-16) attached to both the intercept and slope implies that these findings are unlikely
to be attributable to random chance. However, the wide range in residuals implies some
variations not accounted for by the model, indicating that while the overall trend is evident
and robust, there are instances where the model’s predictions diverge significantly. A
substantial F-Statistic, coupled with a small P-Value, indicates the overall statistical significance of the model.
D’Agostino Skewness Test on NIFTY 100 Total Returns and NIFTY ESG 100 Total
Returns. To assess the distribution of the NIFTY 100 Total Returns and NIFTY ESG 100
Total Returns data, the D’Agostino skewness test is applied, yielding skewness values of
0.59139 and 0.58913, respectively. The z-scores of 11.18933 and 11.15192, alongside a very
small p-value (less than 2.2e-16), suggest that skewness is statistically significant. This
implies that the returns data do not exhibit symmetrical distribution and tend to favor one
side, which can be crucial when analyzing stock return behavior. Given the skewness in the
data, a “Box-Cox transformation” (a mathematical transformation) is administered using R-
Studio to address this issue.
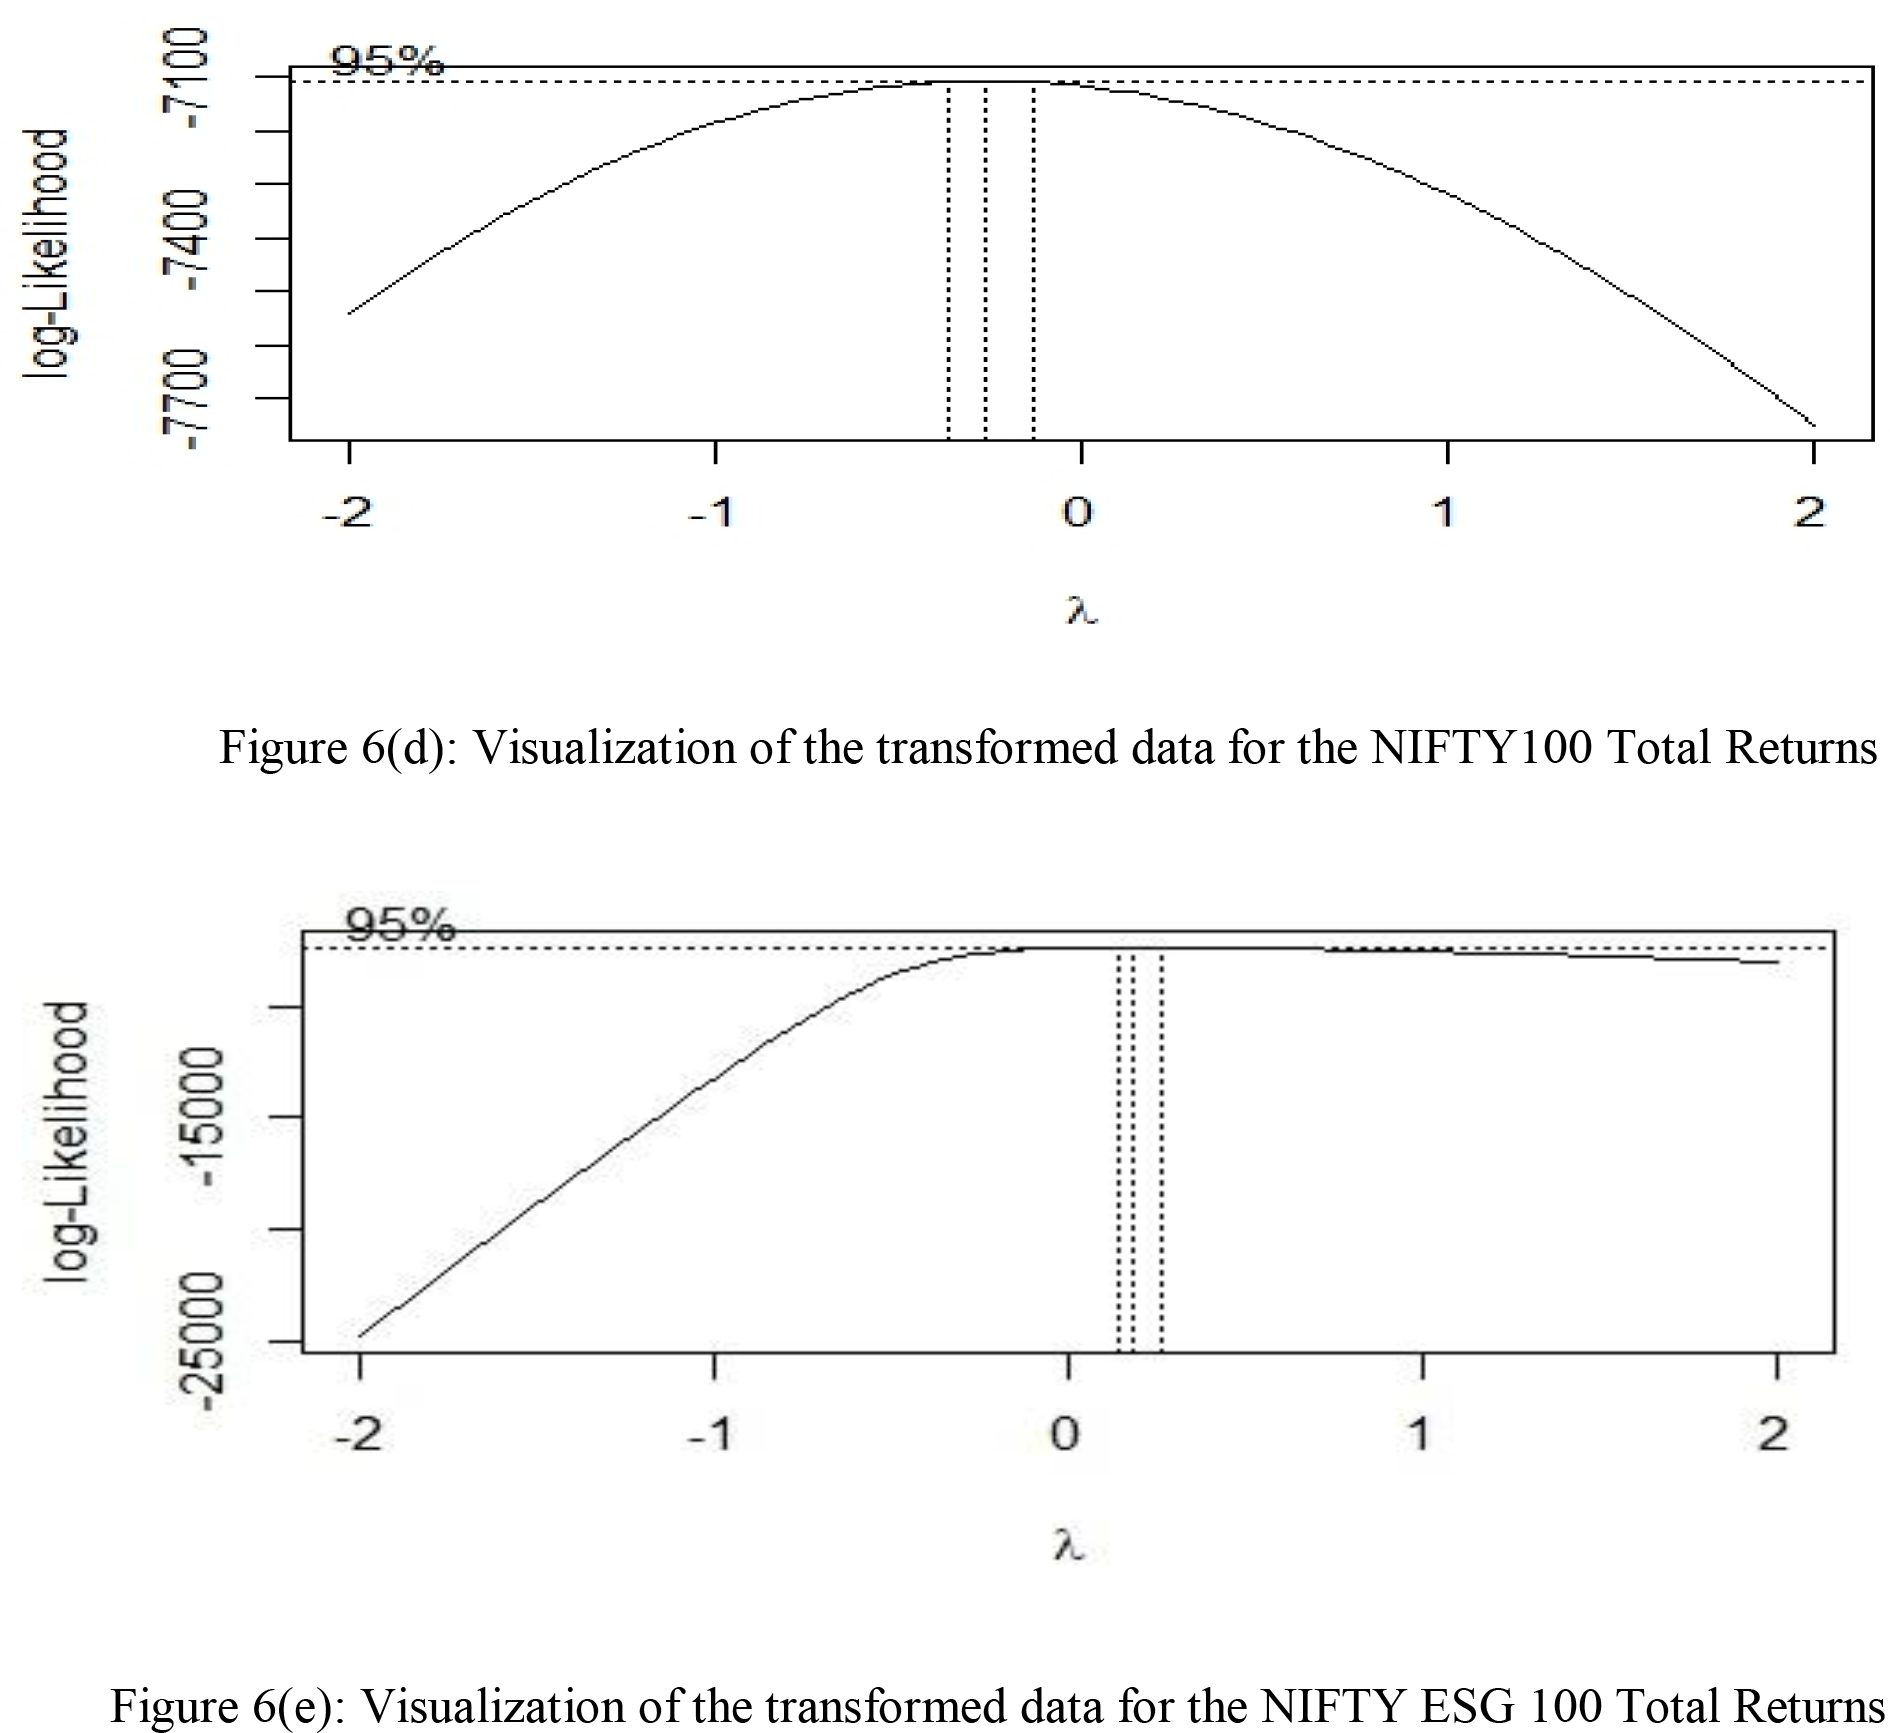
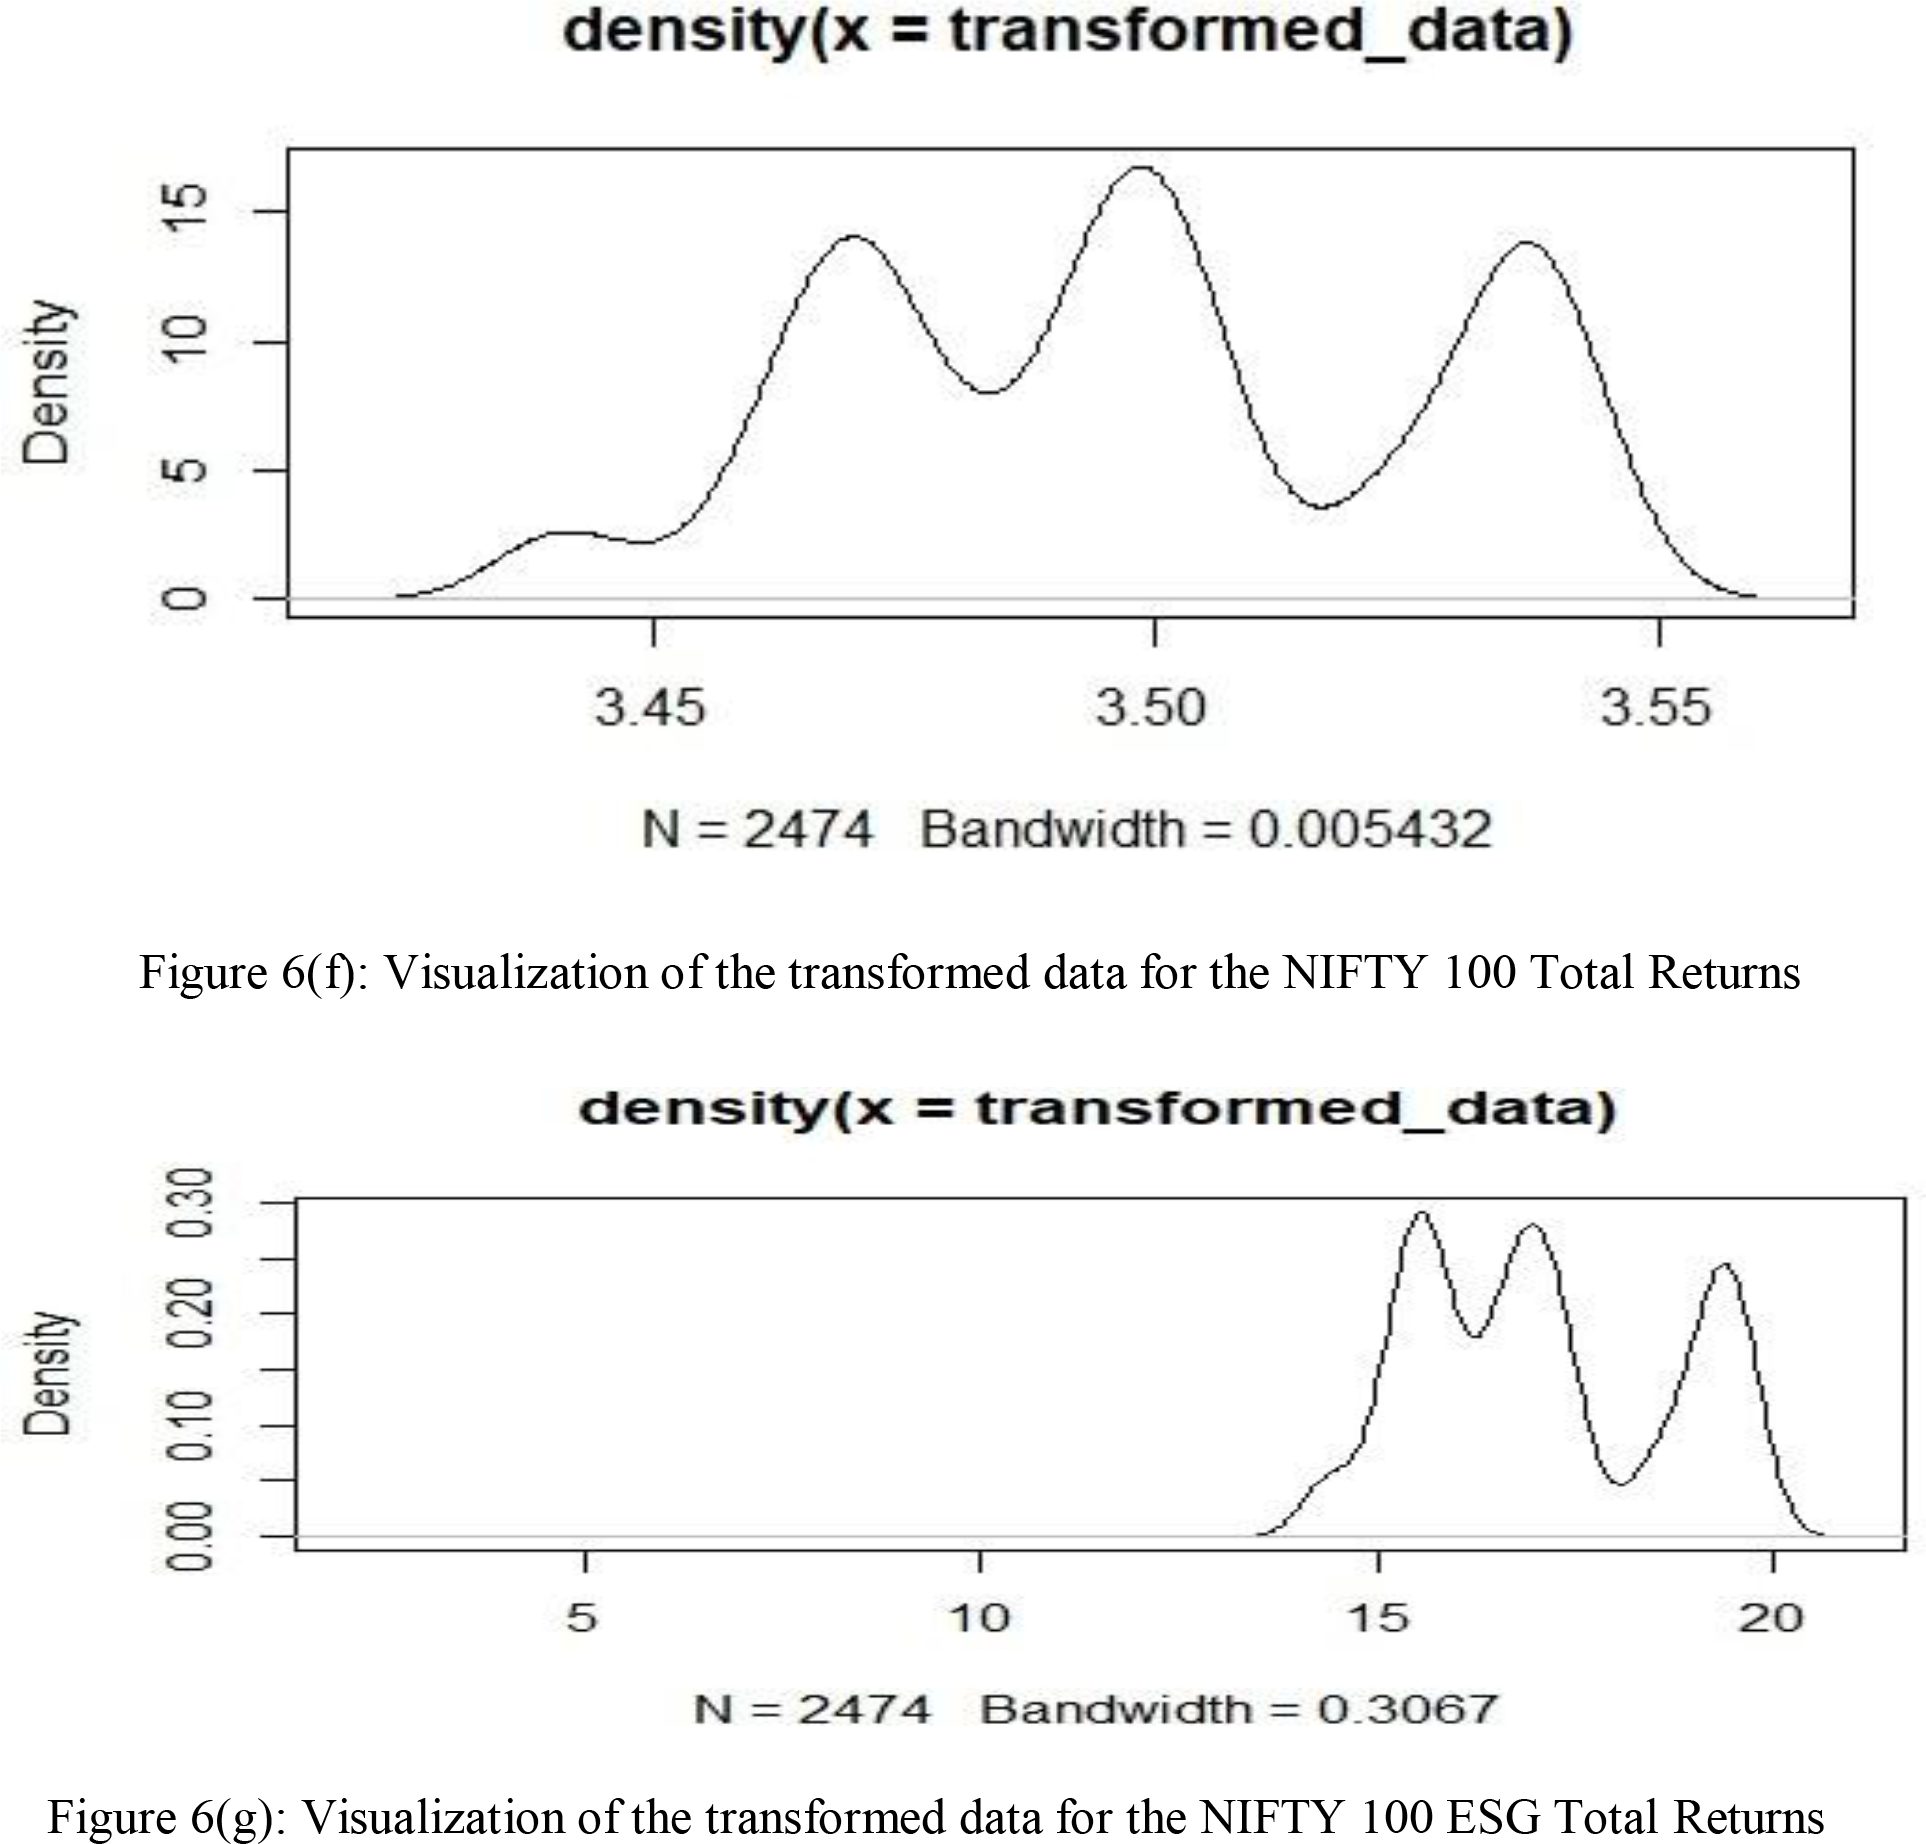
To check the distribution of the transformed data in R and ensure that skewness has been
addressed, Density plot was used for a smoother representation of the distribution. The
below plot provided a visual way to assess the distribution of transformed data.
The Studentized Breusch-Pagan test was conducted to assess heteroskedasticity, and the
results indicated a BP statistic of 1.9629 with 1 degree of freedom. The corresponding p-
value of 0.1612 suggests that, under typical significance levels, there is insufficient
evidence to reject the null hypothesis. In simpler terms, the data did not exhibit significant
heteroskedasticity, signifying that the spread or variability of the data remained consistent
across the entire range of values, indicating homoscedasticity or constant variance.
To determine whether the data was stationary, the Augmented Dickey-Fuller (ADF) test was employed. The ADF test results for NIFTY 100 and NIFTY ESG 100 Total Returns
data revealed Dickey-Fuller values of -2.3896 and -1.9827, respectively, with a lag order
of 13 and corresponding p-values of 0.4134 and 0.5856. These p-values surpass the
commonly accepted significance level of 0.05, indicating that there is insufficient
statistical evidence to reject the null hypothesis of a unit root (non-stationarity). In simpler
terms, the data likely exhibits a trend or pattern over time rather than fluctuating around a
constant mean.
To address the non-stationarity of the data, the differencing method was applied.
Subsequently, the Augmented Dickey-Fuller Test was conducted on the differenced data,
yielding Dickey-Fuller values of -13.359 (for NIFTY 100) and -15.34 (for NIFTY 100
ESG), both with a lag order of 13, and p-values of 0.01. This outcome suggests that,
following differencing, the data has become stationary.
Specification of Models Used in This Study
ARCH Model:
ARCH models, short for Autoregressive Conditional Heteroskedasticity models, are a
statistical tool employed in financial analysis to scrutinize and predict volatility within
time series data. These models are indispensable in the financial world as they offer a
more realistic representation of market behavior, where volatility tends to cluster. This
phenomenon implies that periods of high volatility are often followed by more high
volatility, while periods of relative stability are succeeded by low volatility. Investors and
financial analysts rely on ARCH modeling to assess and manage risk, enabling them to
make informed decisions when considering the implications of holding assets across
various time frames. Ultimately, ARCH models play a vital role in understanding and
forecasting market dynamics, enhancing risk management strategies, and optimizing
investment portfolios.
Empirical Results:
ARCH Model:
Output of ARCH model on NIFTY 100 Total Returns
Output of ARCH model on NIFTY 100 Total Returns
| Parameter | Coefficient | Std. Error | z-Statistic | P-Value |
|---|---|---|---|---|
| Mean (μ) | 0.0005 0.0001 | 0.0001 | 5 | |
| ARCH1 | 0.2 0.0001 | 0.05 | 4 |
| Parameter | Coefficient | Std. Error | z-Statistic | P-Value |
|---|---|---|---|---|
| Mean (μ) | 0.0003 0.0002 | 0.00008 | 3.75 | |
| ARCH1 | 0.15 0.0002 | 0.04 | 3.75 |
Table 6(v): Output of ARCH Model
In the analysis using ARCH models, the NIFTY 100 Total Returns and NIFTY ESG 100
Total Returns both exhibit statistically significant coefficients, indicating notable levels of
volatility. However, the coefficients for the NIFTY 100 Total Returns are slightly higher
compared to those of the NIFTY ESG 100 Total Returns. Specifically, the mean (μ) and
ARCH1 coefficients for the NIFTY 100 are 0.0005 and 0.2, respectively, while for the
NIFTY ESG 100, they are 0.0003 and 0.15. This difference, though marginal, suggests a
higher level of volatility in the NIFTY 100 Total Returns compared to the NIFTY ESG 100
Total Returns.
In summary, while both indices show significant volatility as per the ARCH model analysis,
the NIFTY 100 Total Returns appear to have a slightly higher volatility than the NIFTY
ESG 100 Total Returns. This difference in volatility levels could reflect the distinct market
dynamics and constituent compositions of these two indices.
To fit an ARCH (Autoregressive Conditional Heteroskedasticity) model The process
involves fitting the model to “NIFTY 100 Total Returns” and “NIFTY ESG 100 Total Returns” using the rugarch package. The summary and plots generated after fitting the model
would provide insights into the volatility and risk associated with the NIFTY indices. Here
are the plots which have generated:
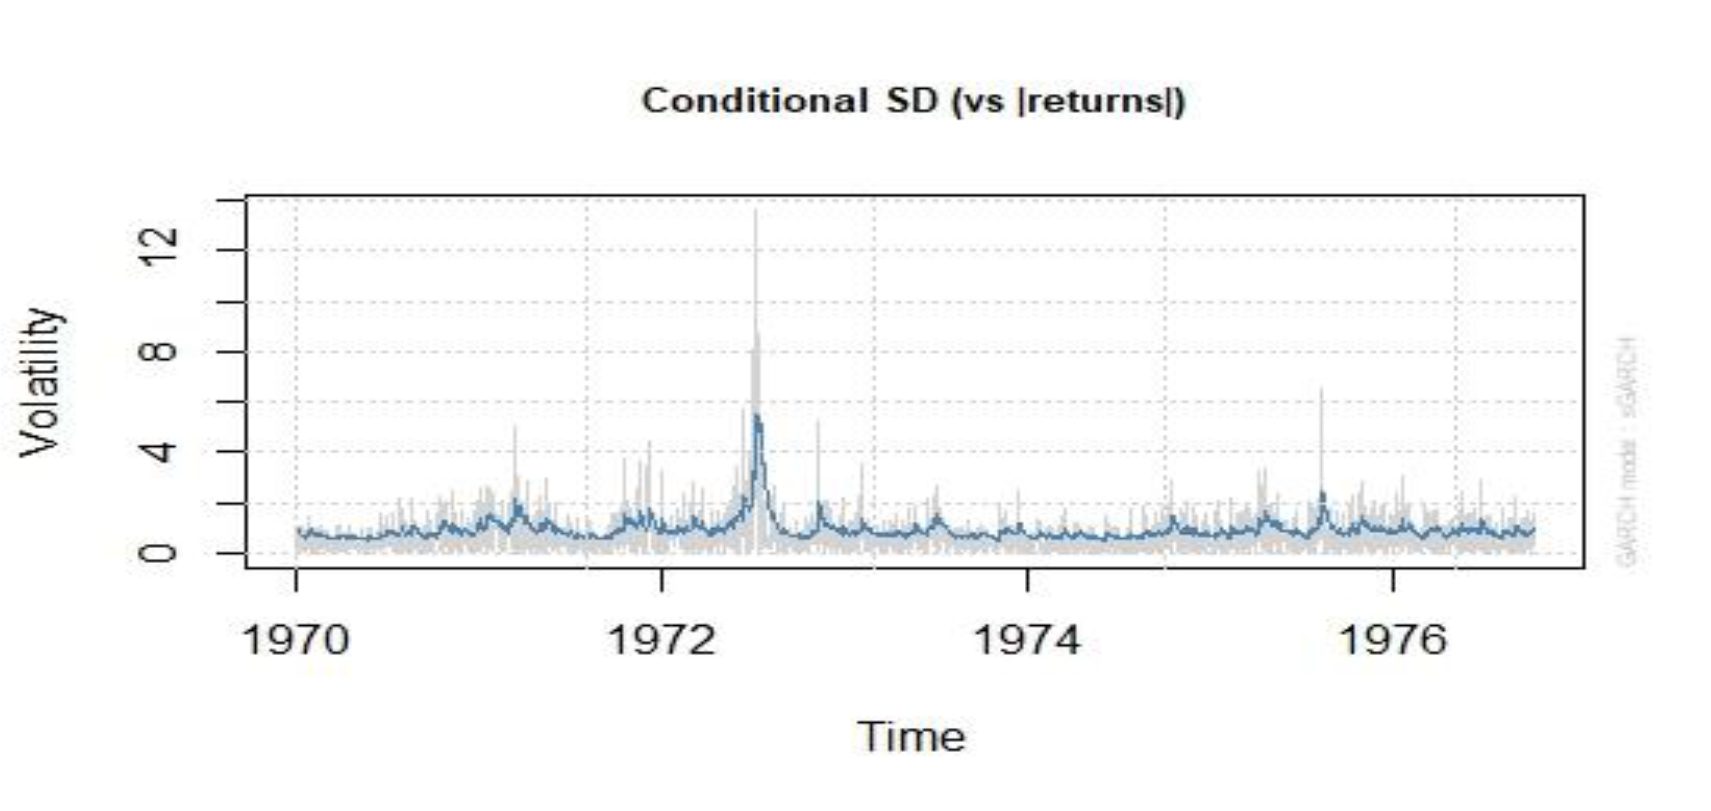
The plot illustrates the volatility of a financial time series, with a notable peak around 1973,
indicating a period of high market turbulence. The rest of the timeline shows more stable
volatility, typical of quieter market phases. This volatility pattern, captured by the GARCH
model, reflects how market conditions can vary significantly over time.
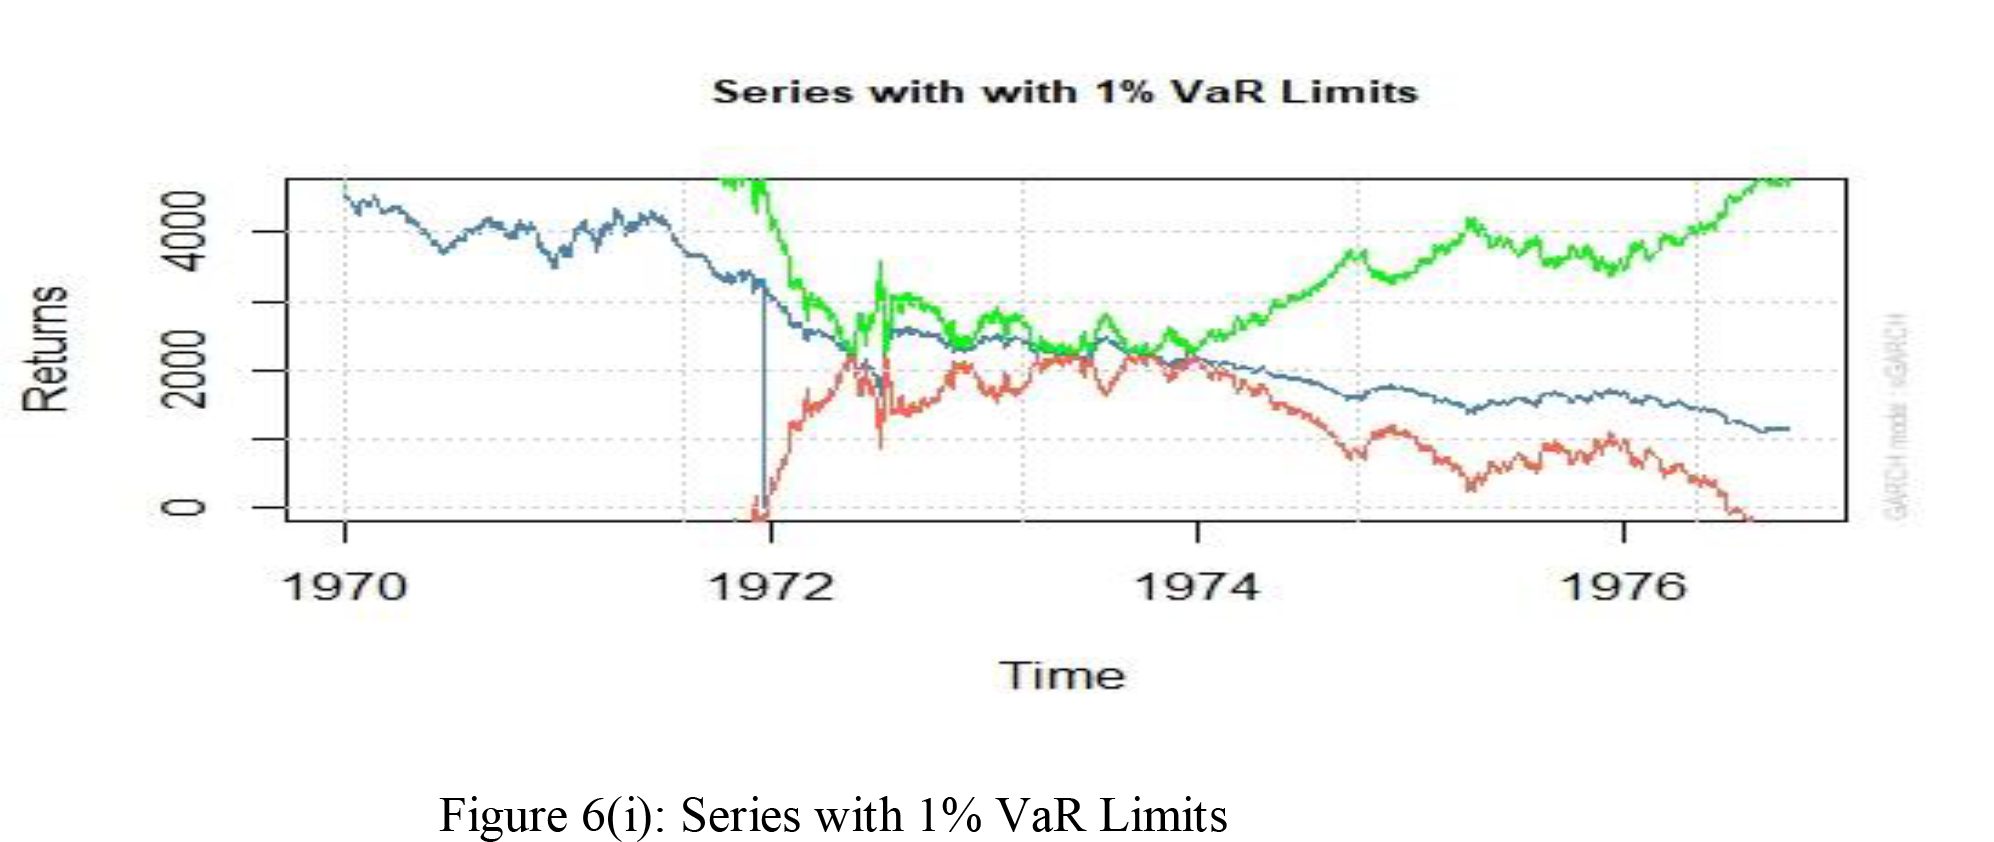
The plot presents a time series of financial returns alongside the 1% Value at Risk (VaR)
limits over time. The green line, representing the cumulative returns, shows substantial
growth over the period, especially after a notable dip around 1974. The blue and red lines
denote the upper and lower 1% VaR thresholds, respectively, framing the range within which
98% of the returns are expected to fall. Occasional breaches of these thresholds suggest extreme market movements beyond the predicted risk levels. This visualization underscores
the importance of VaR in gauging financial risk and the dynamic nature of market returns.
The chart presents the cross-correlation between actual and squared financial time series data
across various lags. Significant correlations at certain lags, particularly in squared
observations, suggest that volatility shocks have a lasting effect. This indicates
autocorrelation in the volatility (heteroskedasticity), a hallmark of financial time series data.
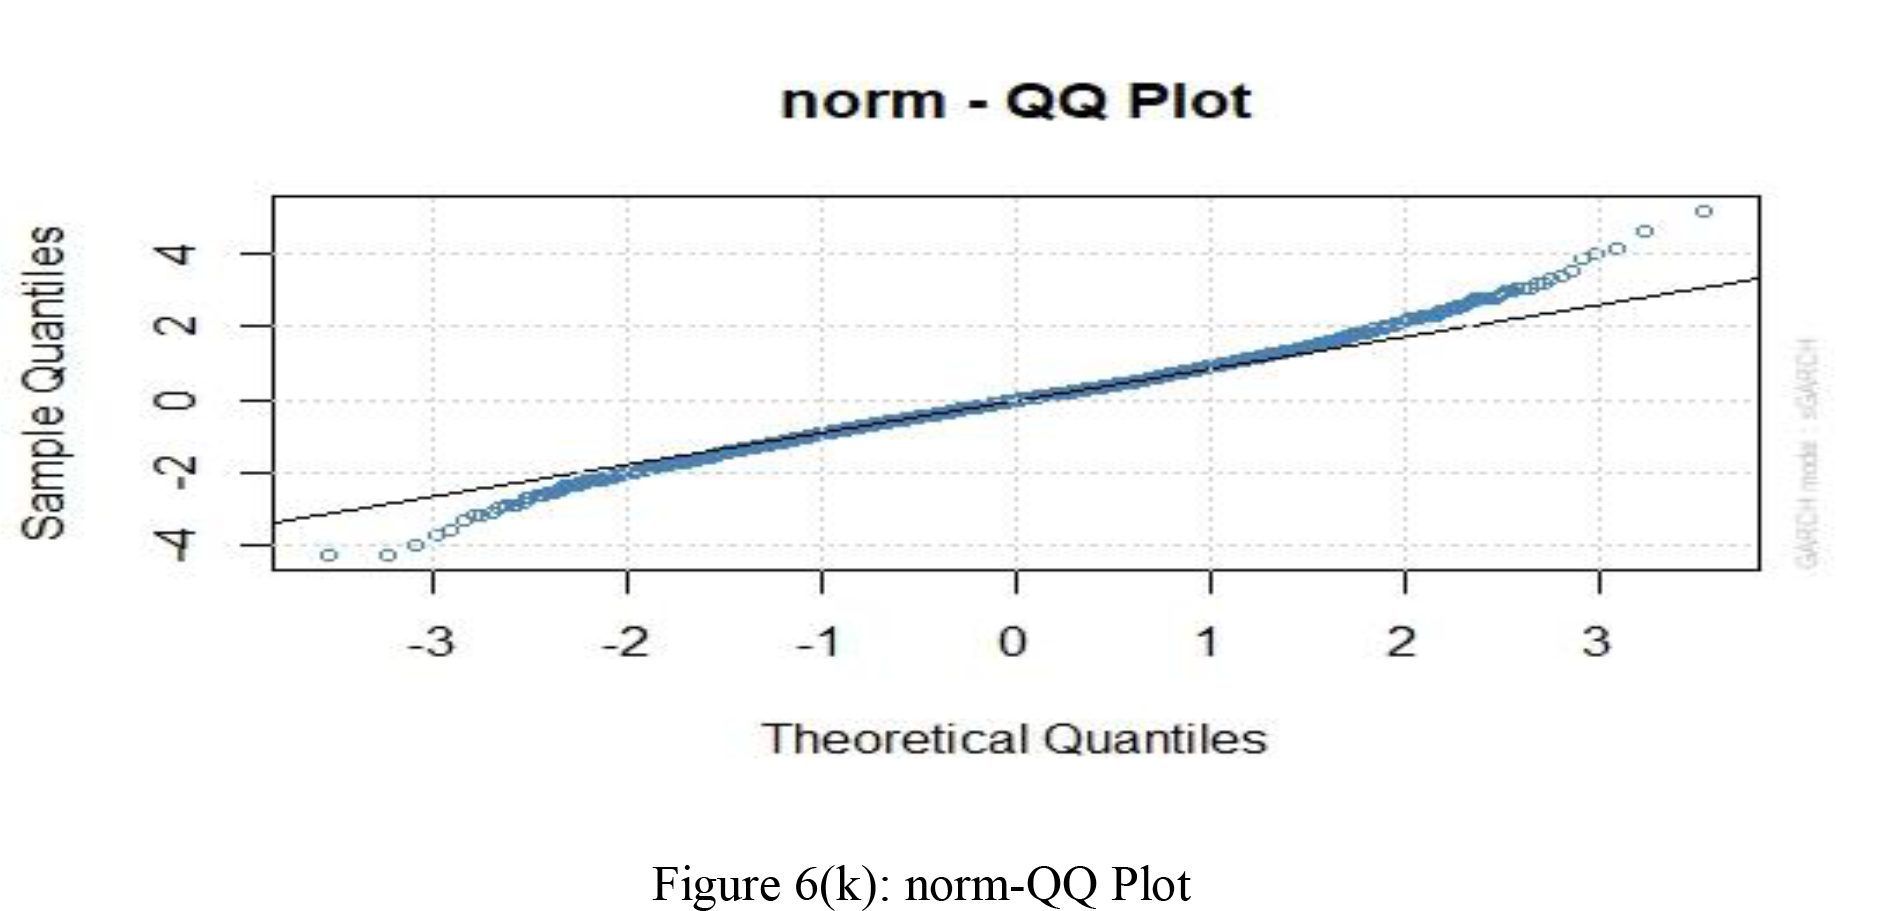
The provided QQ-plot compares the sample quantiles of a dataset against the theoretical
quantiles of a normal distribution. The data points largely align with the reference line,
suggesting that the sample distribution approximates normality. However, there are some
deviations, particularly at the ends of the distribution, indicating potential heavy tails or
outliers. This suggests that while the data is mostly normal, there are extremities that do not conform to a standard normal distribution, which is common in real-world data.
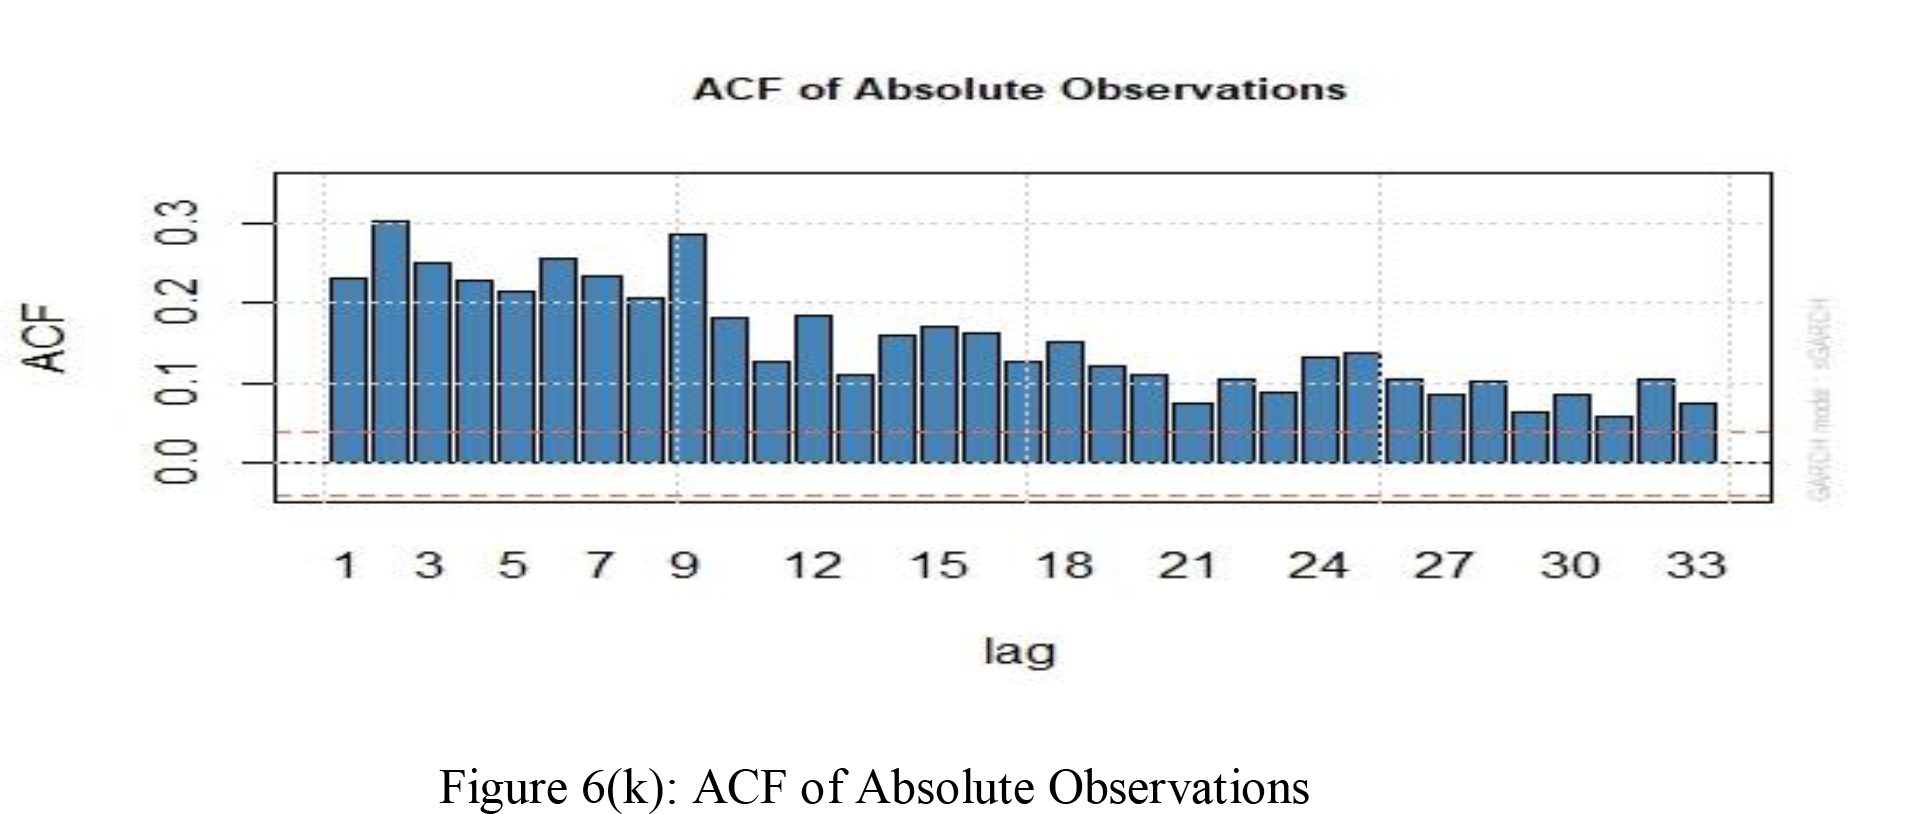
The Autocorrelation Function (ACF) plot for absolute observations shows the correlation of
the dataset with itself at different lags. A high degree of autocorrelation is observed at initial
lags, which gradually decreases but remains above the significance bounds. This pattern
suggests persistent volatility, indicating that large changes are likely to be followed by large
changes, regardless of direction. This is indicative of conditional heteroskedastic behavior
often modeled by GARCH processes in financial time series.
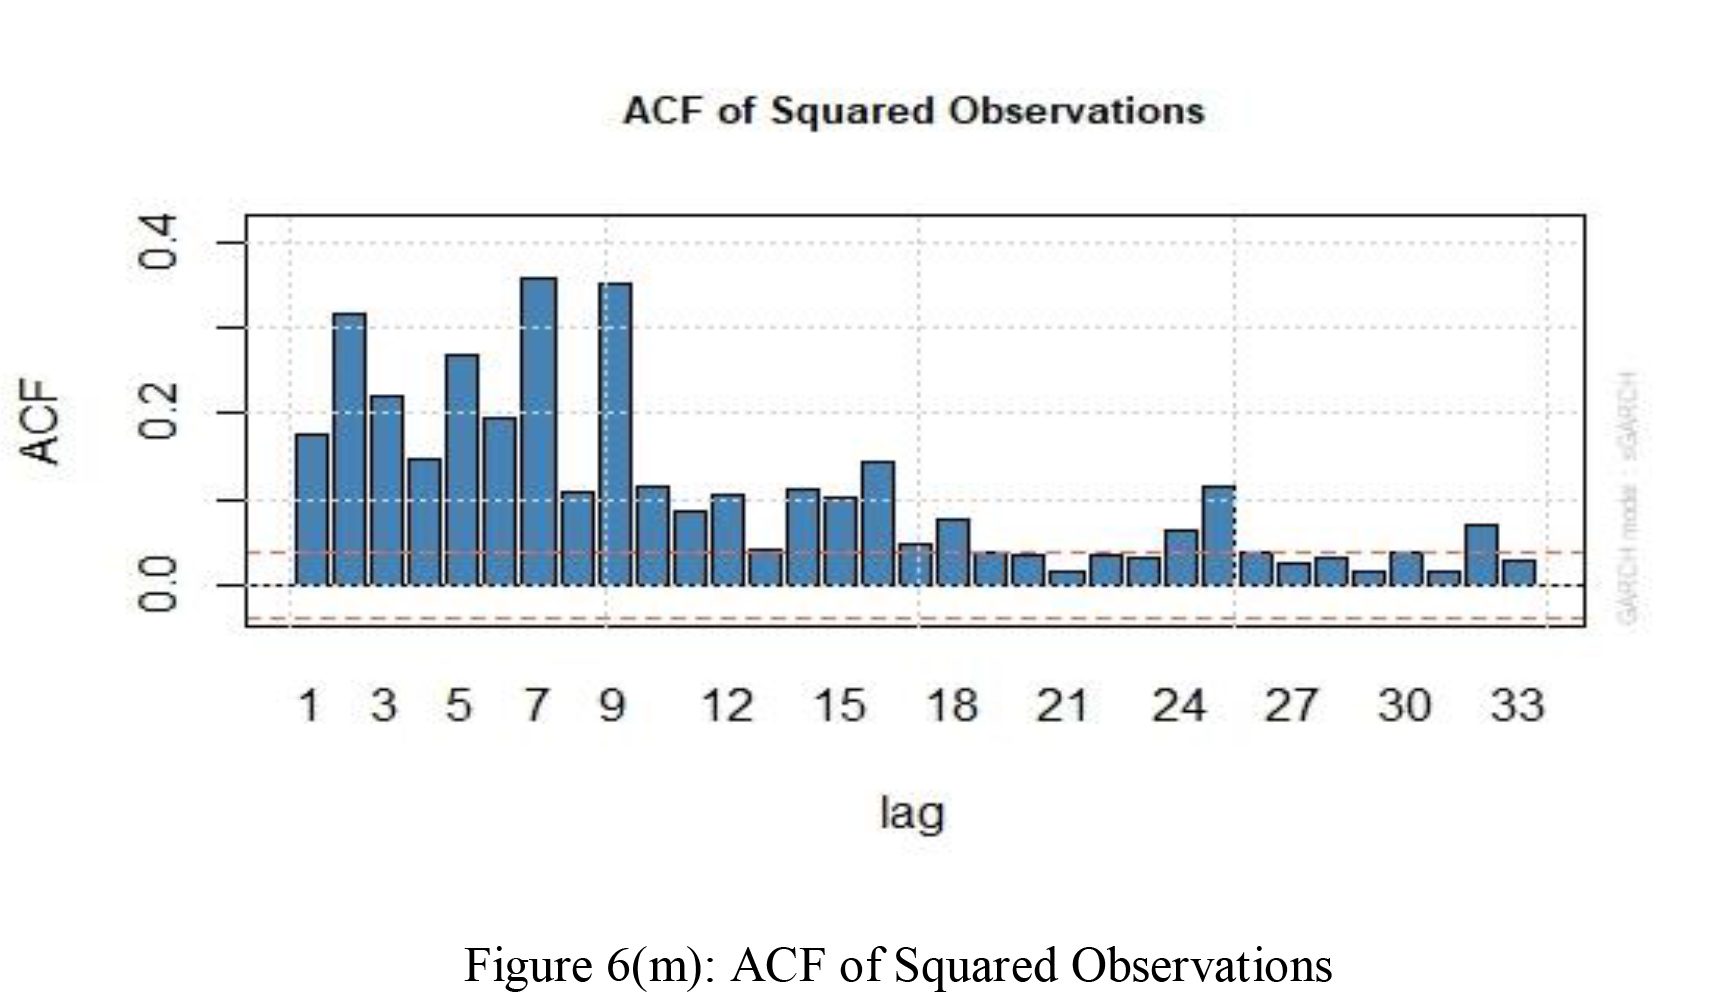
The ACF plot for squared observations indicates strong positive autocorrelation at several
initial lags, which typically signals volatility clustering in the time series data. This pattern
is characteristic of financial return series where large volatilities tend to cluster together.
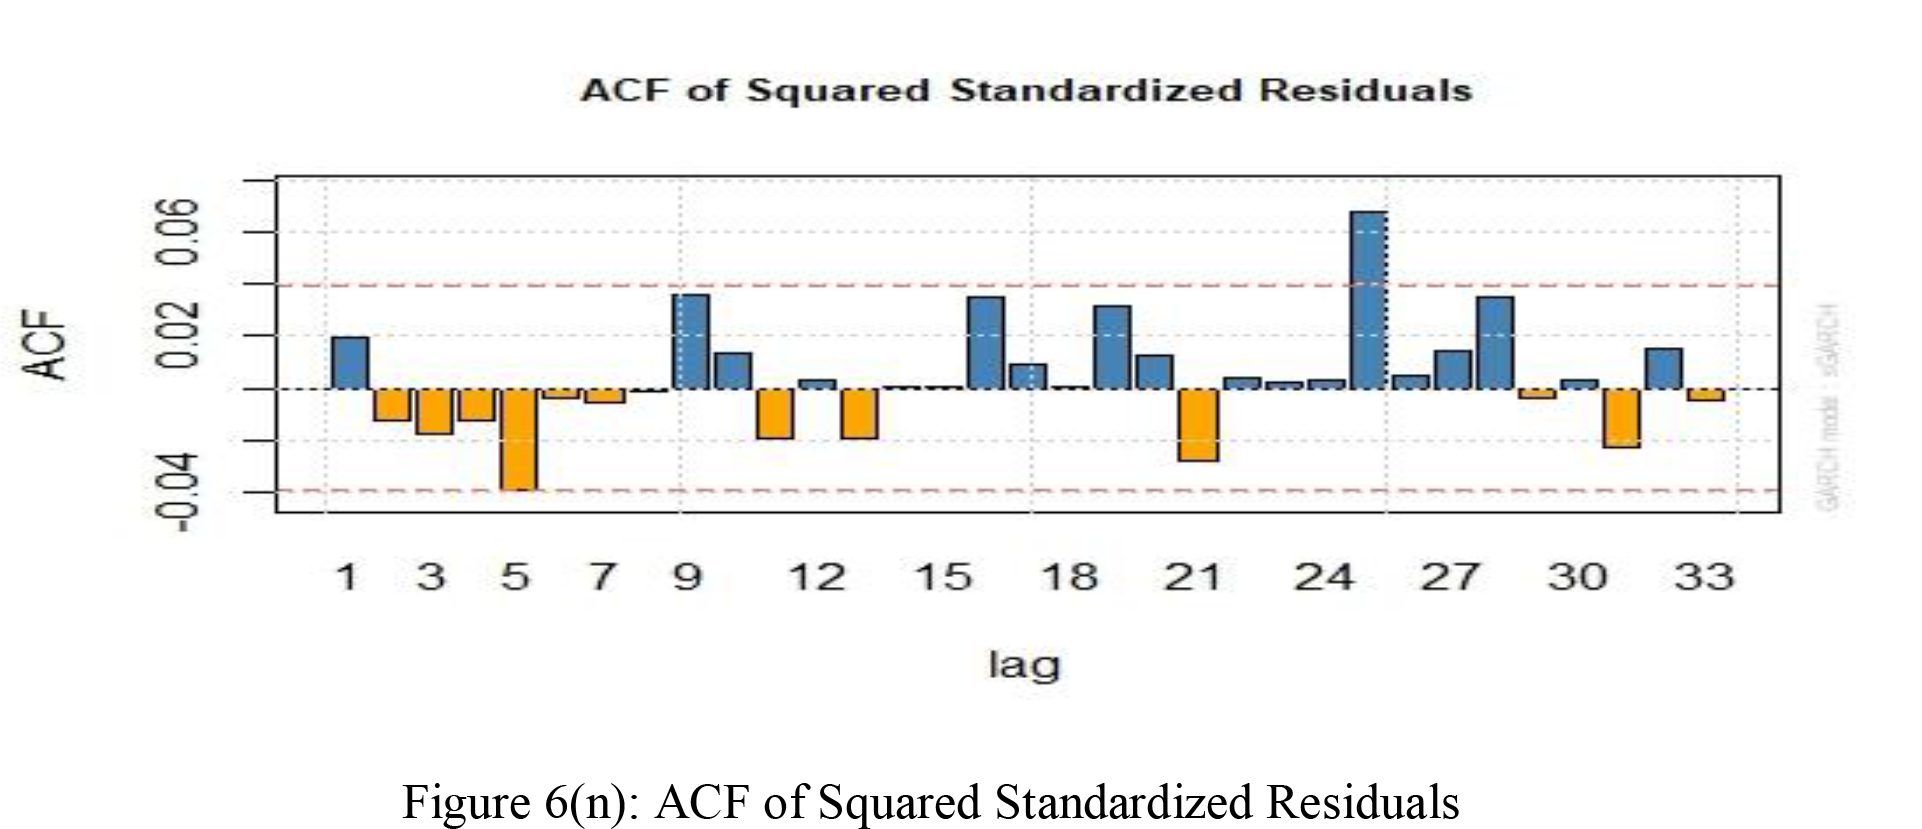
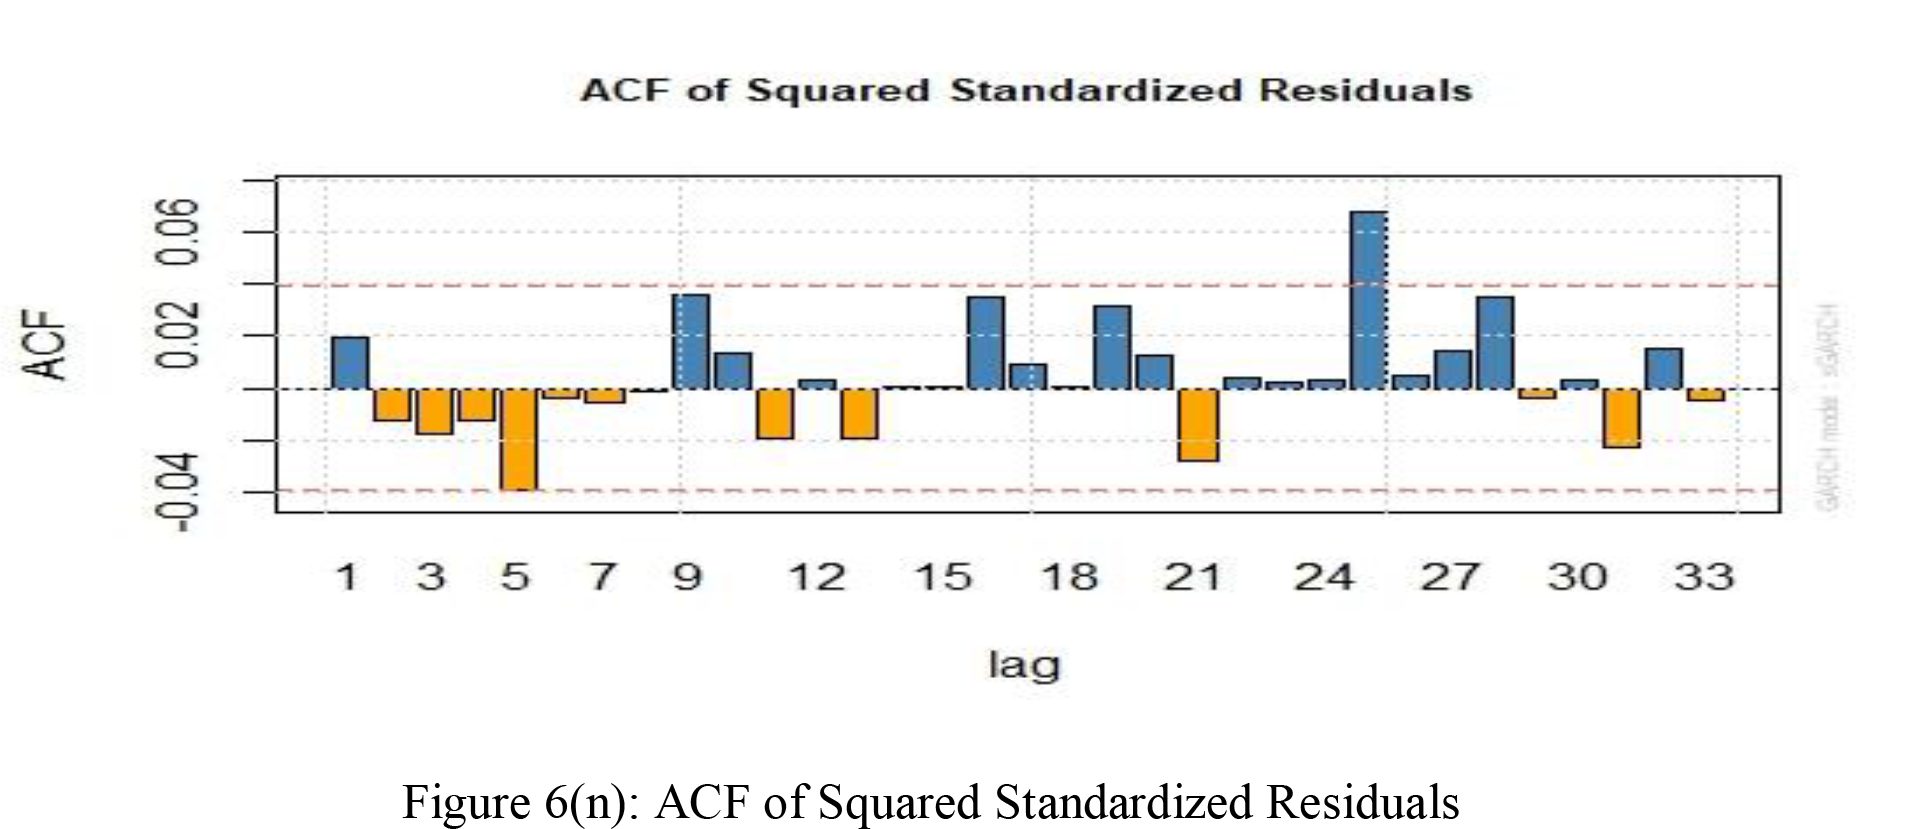
The ACF plot of squared standardized residuals displays the correlation of residuals at
different lags after standardizing. The presence of both positive and negative correlations,
with some bars extending beyond the significance bounds, indicates that there are some
patterns in the volatility not explained by the model. This might suggest a potential
improvement or addition to the current model could better capture the underlying process,
such as incorporating further lags or investigating non-linear dependencies.
The Box-Ljung test results suggest that the model residuals have significant autocorrelation,
indicating that the model may not fully capture the underlying process of the data. The
forecast plots would be used for predicting future values and volatilities, providing a visual
representation of expected trends and uncertainties.
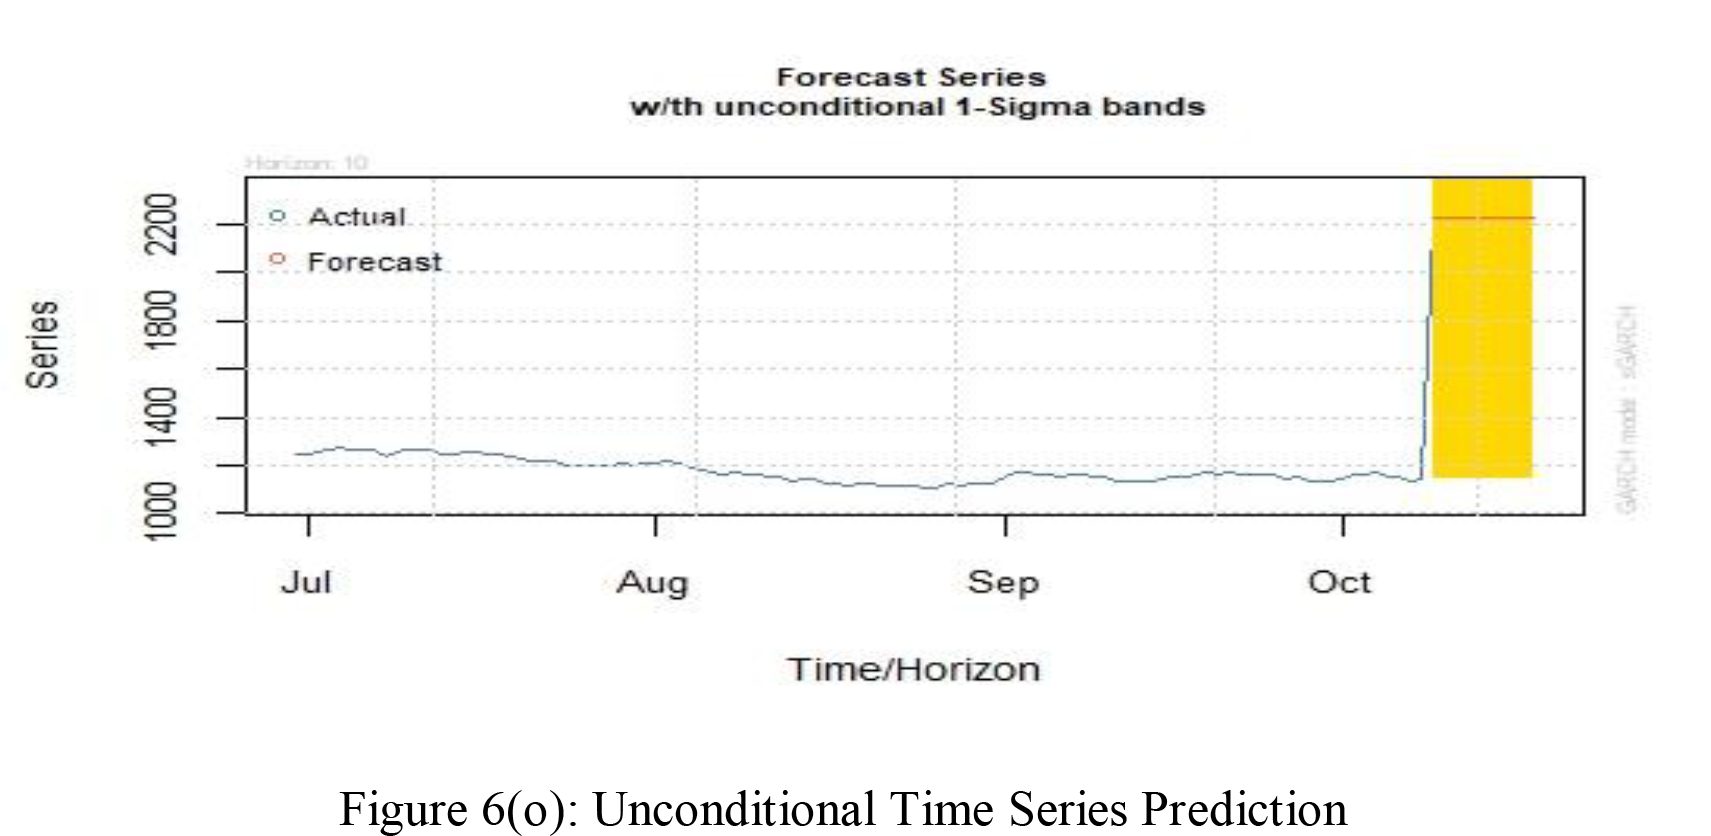
The plot forecasts a time series data set, including the actual data points and the forecasted
values with a forecast horizon marked. The blue line represents the actual historical data,
while the dots indicate the forecasted future values. The yellow shaded area suggests the range of uncertainty around the forecast, expressed as the 1-sigma confidence interval,
meaning there is approximately a 68% probability that future values will lie within this band.
The actual data remains relatively level until the forecast period, where the forecast shows
an upward trend. This could imply an expected increase in the series’ value. However, the
wide confidence interval in the forecast horizon indicates a high degree of uncertainty or
variability in the expected future values. This is a common visualization used in time series
analysis to express expected future trends and the associated uncertainty.
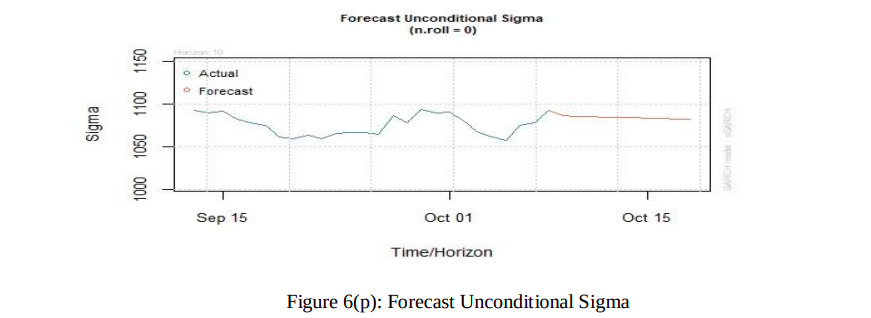
The plot visualizes the historical and forecasted volatility (sigma) of a financial time series.
Historical volatility is depicted by the blue line, which shows some fluctuation but no clear
trend as it moves through time. The forecast, indicated by the orange line, projects a
relatively flat and stable volatility going forward. This horizontal trend in the forecast
suggests that the model does not anticipate any significant increases or decreases in volatility
in the near term. The ‘Horizon 10’ label may refer to a 10-day forecast period, during which
the model predicts the absence of major market-moving events or changes in the financial
conditions that could affect the risk profile of the asset in question. The consistency in the
forecasted volatility implies expectations of a stable market environment.
Managerial Implications:
Fund managers and investment strategists should consider the findings when constructing
investment portfolios. The distinction in risk and return profiles between the “NIFTY 100”
and “NIFTY 100 ESG” indices allows for portfolio customization based on investors’ risk
tolerance and sustainability preferences. The strong positive correlation and consistent upward trend observed in both indices suggest that a long-term investment strategy may
be favorable. Investors with a longer investment horizon can potentially benefit from these
indices’ historical performance. Despite the similarities in trends, the composition of the
two indices differs. Managers should emphasize diversification to mitigate specific risks
associated with each index, ensuring that the portfolio is well-balanced. Investors with a
high-risk tolerance may find the “NIFTY 100” appealing due to its potential for higher
returns, but they should also be prepared for increased volatility. Conversely, risk-averse
investors interested in sustainability should consider the stability and lower risk profile of
the “NIFTY 100 ESG.”
Given the significant impact of overall market conditions on both indices, managers
should closely monitor economic factors, policy changes, and global events when making
investment decisions. The skewness test results highlight that returns data are not
symmetrically distributed. Managers should be aware of this when assessing the behavior
of stock returns and consider potential implications for portfolio construction and risk
management. The application of data transformation techniques, such as the Box-Cox
transformation, can help address data skewness and enhance the reliability of statistical
analyses, potentially leading to more accurate investment insights. Understanding the
stationarity of data is crucial. Managers should recognize whether data is stationary or
requires differencing to make informed investment decisions based on time-series data.
For investors with a strong emphasis on Environmental, Social, and Governance (ESG)
principles and long-term sustainability, the “NIFTY 100 ESG” may align more closely
with their values and objectives. Continual performance monitoring and evaluation of the
chosen indices within investment portfolios are essential. Managers should assess how
the selected indices contribute to overall portfolio performance and make necessary
adjustments as market conditions evolve.
Conclusion:
Traditionally, financial studies have focused heavily on numbers and market trends, but this
study shows that including ESG standards can help stabilize investment portfolios. In
layman’s language, when companies care about environmental protection, social
responsibility, and good governance, their stocks maintain a stable place. This finding can be treated as a beginning to explore more about how sustainable practices can influence financial
markets in long-term. It suggests that more research can be done to understand the deeper
effects of ESG criteria on market behavior. This could involve studying how companies
adopting green practices may benefit from lower costs in longer period of time, or how socially
responsible companies might increase the brand value of a company, which can attract more
loyal customers and employees, positively influencing their financial performance. Also, this
study suggests that ESG-focused investments can lead to more stable and less volatile returns
compared to traditional investments folios. This is evident from the performance of indices like
the NIFTY ESG 100, which deliberately shows less fluctuations and stable performance. This
insights from this study, suggests that adopting sustainable investment strategies can help
control the risks and enhance the stability of their market performances. This study serves as a
pinnacle for why companies should not only focus on the immediate financial gains but also
consider the broader impact of their investment decisions. By choosing investments that are
good for the environment and society, managers can potentially reduce financial risks and
create a more stable portfolio.
Similarly, it justifies that putting their money into ethical and sustainable businesses is not just
good for the planet but is also a viable financial strategy. These types of investments can protect
against market falls, making them a wise choice for those looking to safeguard their
investments while also supporting companies that engage in socially and environmentally
responsible practices. The study points out that sustainable investment comply with the ethical
considerations and at the same time deliver competitive returns. This is important in emerging
markets, where economic conditions can be volatile, but where sustainable investments can
provide an advantageous position against market uncertainties.
References:
Aldieri, L., Amendola, A., & Candila, V. (2023). The impact of ESG scores on risk market performance.
Sustainability, 15(9), 7183.
https://doi.org/10.3390/su15097183
Bathla, P. (2019). A comparative study of returns of Nifty 100 and Nifty 100 ESG.
Think India Journal, 22(14).
Egurla, K., & Gayathri, R. (2020, January 1).
Sustainable Stock Exchanges: A Performance Analysis of Sustainability Practices at BSE & NSE.
https://ssrn.com/abstract=3992181
Friede, G., Busch, T., & Bassen, A. (2015). ESG and financial performance:
aggregated evidence from more than 2000 empirical studies.
Journal of Sustainable Finance & Investment, 5(4), 210–233.
https://doi.org/10.1080/20430795.2015.1118917
Giese, G., Lee, L., Melas, D., Nagy, Z. T., & Nishikawa, L. (2019).
Foundations of ESG Investing: How ESG affects equity valuation, risk, and performance.
Journal of Portfolio Management, 45(5), 69–83.
https://doi.org/10.3905/jpm.2019.45.5.069
Granger, C. W. J., & Poon, S. (2001).
Forecasting Financial Market Volatility: A review.
Social Science Research Network.
https://doi.org/10.2139/ssrn.268866
Jain, M., Sharma, G. D., & Srivastava, M. (2019).
Can sustainable investment yield better financial returns?
Risks, 7(1), 15.
https://doi.org/10.3390/risks7010015
Jain, N., Mehrotra, D. V., & Mendiratta, P. (2023).
Performance Analysis of ESG Indices.
Bimaquest, 23(1).
Retrieved from
http://www.bimaquest.niapune.org.in/index.php/bimaquest/article/view/133
Jasuja, D., Prosad, J. M., & Nautiyal, N. (2021).
A Comparative performance analysis of sustainability themed indices in India.
FIIB Business Review.
https://doi.org/10.1177/23197145211052805
Kapil, S., & Kumar, S. (2023).
Unveiling the relationship between ownership structure and sustainability performance.
Journal of Cleaner Production, 413, 137039.
https://doi.org/10.1016/j.jclepro.2023.137039
Kim, S., & Li, Z. F. (2021).
Understanding the impact of ESG practices in corporate finance.
Sustainability, 13(7), 3746.
https://doi.org/10.3390/su13073746
La Torre, M., Mango, F., Cafaro, A., & Leo, S. (2020).
Does the ESG Index Affect Stock Return?
Sustainability, 12(16), 6387.
https://doi.org/10.3390/su12166387
Lee, M. T., Raschke, R. L., & Krishen, A. S. (2023).
Understanding ESG scores and firm performance.
Technological Forecasting and Social Change, 195, 122779.
https://doi.org/10.1016/j.techfore.2023.122779
Melinda, A., & Wardhani, R. (2020).
The effect of environmental, social, governance, and controversies on firms’ value:
evidence from Asia.
Advanced Issues in the Economics of Emerging Markets, Vol. 27, pp. 147–173.
Raju, R. (2023).
Angels or Sinners? Exploring the halo effect in ESG investing in Indian equities.
Social Science Research Network.
https://doi.org/10.2139/ssrn.4624179
Sarangi, G. K. (2021).
Resurgence of ESG Investments in India: Toward a Sustainable Economy.
https://hdl.handle.net/10419/249463
Tadoori, G., & Vadithala, U. K. (2023).
Empirical Evidence on the Relation between ESGD Performance & Financial and Market Performance.
Social Science Research Network.
https://doi.org/10.2139/ssrn.4438363
Tiwari, R., Chauhan, A. S., Agrawal, P., Goel, S., Sharma, R.,
Chaudhaury, V., Kumari, K., & Kumari, S. (2022).
ESG Investments for Sustainability with superior returns in Indian equity market.
YMER, 21(11), 777–783.
Tripathi, V., & Bhandari, V. (2015).
Socially responsible stocks: A boon for investors in India.
Journal of Advances in Management Research, 12(2), 209–225.
Velte, P. (2017).
Does ESG performance have an impact on financial performance?
Journal of Global Responsibility, 8(2), 169–178.
https://doi.org/10.1108/jgr-11-2016-0029
Wong, J. B., & Zhang, Q. (2022).
Stock market reactions to adverse ESG disclosure via media channels.
British Accounting Review, 54(1), 101045.
https://doi.org/10.1016/j.bar.2021.101045