







Harsh Thekdi, Himanshu Maithani*
Lal Bahadur Institute of Management, Delhi
Abstract:
Adecade ago,Fama and French(2015a)proposed a five-factor model by adding profitability and investment factors to their three-factor model.This model outperforms the three-factor model previously proposedby Fama and French (1993). Using the current tumultuous 5-year period from 2019 to 2024, we have investigated the performance of a five-factor model in a developing ecosystem like the Indian equity market. We find that both the three-factor and five-factor models have found limited success. Factors like size (SMB) in the three-factor model and investment in assets (CMA) in the five-factor model have not been found significant in determining the returns of Indian equities. However, the five-factor model has slightly improved in explaining stock market returns. We also find that, despite the results presented by Fama and French (2015a), the value factor has retained its explanatory power in the presence of the investment and profitabilityfactors.
Key Words: Fama-French Model, CAPM, Market Risk Premium, Market Factor, Market Risk Proxy, Value returns, SMB (Small Minus Big), HML (High minus Low), RMW (Robust Minus Weak), CMA (Conservative Minus Aggressive).
Introduction
Relationships between risk and return have always been a cornerstone in determining the dynamics of financial markets and hence have always sparked interest in researchers and investors alike. Asset pricing models like the Capital Asset pricing Model (CAPM) have historically provided a foundational framework to explain this relationship. However, only market has been able to predict about 70% of market behavior and given the rise in complexities of the market there are various other factors that determine the behaviour of stock market (French F. a., 1993). These additional factors have been supplemented by multifactor frameworks like Fama-French Three factor and Five-factor models, which have significantly aided us in determining the stock performance. The period of 2019 to 2024 has been full of volatility and uncertainty, which can be attributed to series of global events like the Covid-19 pandemic, geopolitical tensions, short term deflation and inflation cycles, and rapid technological advancements these have collectivelyreshapedthefinancialmarkets.Fora growing economy like India, that has unique market dynamics, high investor diversity and is increasingly affected by international policies andmarketmovements. The Fama-French models have been tested extensively in developed countries like the US andEuropeanUnionand haveprovideda robust framework for predicting the returns through factors such as market, size, value, profitability, and investment. However, the question still persists that will these factors prove its effectiveness in explaining the stock returns in anemergingandvolatilemarketslikeIndia?This research seeks to address this gap by evaluating the performance of Fama French three and five factor models using the data of Nifty 500 index overthe turbulentperiodof2019-2024period. This study is necessary since there has been a growing importance of these emerging markets like India as global investment hub and the uniquechallenges thesemarketsposetoexisting CAPM model. India has been one of the fastest growing economies and it offers a rich testing ground for evaluating whether these multi factor models are universally applicable or they require a contextual adoption. By analysing the stock returns, this research aims to provide insights into the adaptability of multifactor models in volatile, high growth potential markets like India and ultimately offering a practical value to investors,portfoliomanagersandpolicymakers.
Literature Review
Several studies have examined the effectiveness of the Fama-French 3 model in determining the stock returns in the Indian market. (Taneja, 2010) provided evidence that the Fama-French three-factor model is relevant in the Indian context. The study noted that while model captures certain market returns, challenges of size and short term persisted indicating that model might require additional factors or adjustments to accurately determine the behaviour of IndianStockMarkets. However more recent studies like done by (Foye, 2017), highlights the limitations of the Fama-French five factor models in emerging markets, including India. The study found that while the five-factor model outperformed the three factors in Latin American regions, the results were not as positive in Asian markets, these raised questions about impact of profitability and investment premiums in these contexts. (Chiah, 2015) also indicated that the performance of 5 factor model has been varied
across different markets with success in developed economies and some emerging markets, but it failed in other markets especially in Asia. This variability in the application of Fama French models suggests that while the theoretical framework of Fama French model is good, its practical application in different marketslike Indiashouldbechecked. (Sehgal, 2012) examined rational sourced ofstockreturnanomaliesinIndiaandfoundthat Fama-French model has been able to explain only certain factors, but it has not been proved effective.Similarfindings werefound by(Ansari, 2012)whoidentifiedthatmomentumwasfound tobesignificantchallengetoassetpricingmodel in India. Research by (Hu, 2019) on Chinese market provided comparative insights and they suggested that similarchallengesareexistingin otheremergingmarkets. Empirical analysis of the Fama-French 3 factor model have been done effectively by (Taneja, 2010), however we do require certain empiricalevidenceto checkthe implications of 5 factor models especially during these current period which has presented multitude of challenges.
Methodology
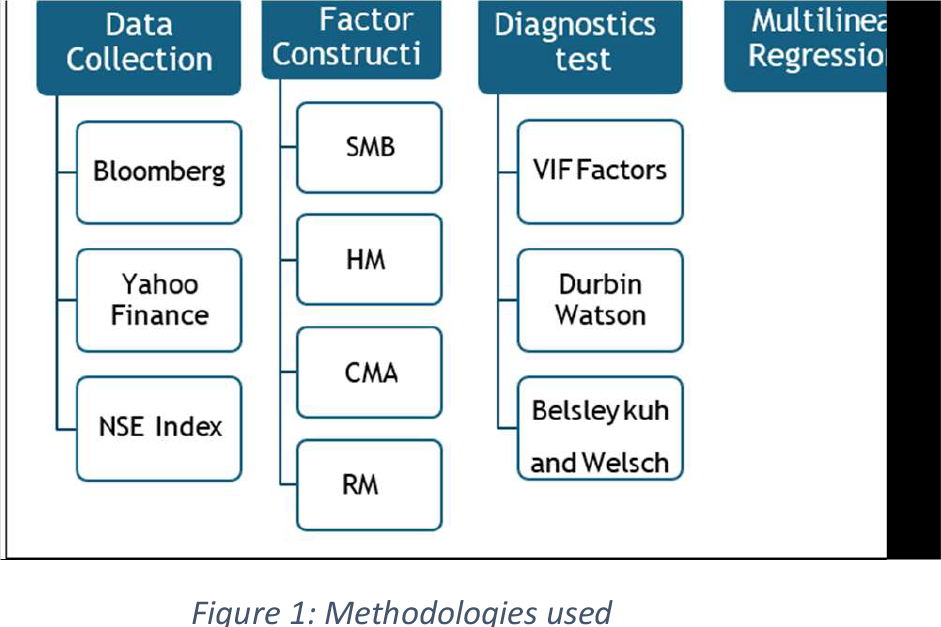
In 1993, after considerable research, Fama and French proposed 3 factor model which is as follows(FrenchF.a., 1993): Rit–Rft=ai+bi(Rm–Rft)+siSMBt+hiHMLt+eit, Where Rit is the return on security or portfolio I for period t, Rft is the risk-free return, Rmt is the return of market on which portfolio is based, SMBt (small minus big) – the return on a diversified portfolio of small stocks minus the return of big stocks, HMLt (high minus low) – the difference between the returns on diversified portfolios of high and low B/M (book to market ratio) stocks, HML is a premium for the under or overvaluationof acompany;andeit–zero-mean residual. Thenin2015,twomorefactorswereaddedinthe existing 3 factor model which were based on profitabilityandinvestmentrate,andthesehave transformed the three-factor model into five factor model (French E. F., 2015), which is as follows: Rit – Rft = ai + bi (Rm – Rft) + siSMBt + hiHMLt + riRMWt+ciCMAt+eit, where RMWt (robust minus weak) shows the differenceinthereturnsondiversifiedportfolios of the stocks with robust and weak profitability, CMAt (conservative minus aggressive) – the difference between the returns on stocks of low and high investment firms, which Fama and Frenchhavecalledconservative andaggressive. All the listed and traded stocks of Nifty 500 were testedusingtheFamaandFrenchapproaches.It has been proven that a five-factor model can be applied to stocks with different risk-return profiles.(Hu, 2019)
Data Selection : Relevant data are taken from Nifty 500 index from November 2019 to October
- The data sources of NSE index, yahoo
finance, Bloomberg, and IIM A digital database hasbeenconsideredtocollectthefollowing: Stock Returns: Daily returns of all the stocks of Nifty 500 were calculated based on their adjustedclosingprice. Market Returns: The Nifty 500 index return was usedasreference formarket returns. Risk Free Rate: Ten year Government of India bond was used as the risk free rate, as it is widely usedinIndianfinancialmarketresearch. Firm-Specific Metrics: Data on market capitalization, shares outstanding, operating profit, asset growth, Total Equity, etc were sourced from Bloomberg, yfinance and company’sannualreports. Portfolio returns: A randomized portfolio was generated using Random function of Excel of Nifty 500 with the weightage provided in accordance withNifty500 pattern. These data were then cleaned to ensure consistency, removing stocks with missing observations or filling them with moving averages. Factor Construction: For FF3FM, Table 1 is displayed, First, we divided all the listed firms are categorized into 2 groups,designated assmall(S)andbig(B),based on their market capitalization and their alignment was checked with Nifty’s Large Cap and Mid-Small Cap classification. Next, we classified them into 3 parts Low(L), medium (M) and high(H), based on book to market ratio of all the listed stocks, these were sorted equally 33%. Ultimately a combined portfolio was generated along with their averaged weighted returns (weighted by total market value) were then calculated outasSL,SM,SH,BL,BM, BH.
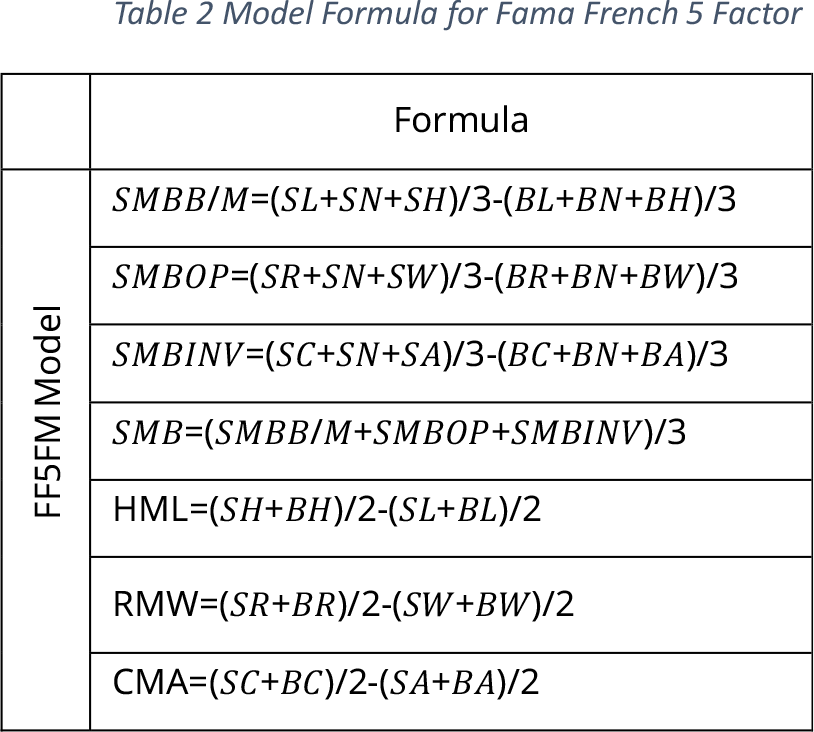
For The factor model, the listed companies were classified similarly into large market value (B) and small market value (S) these were grouped according to the market capitalization, and the quantiles of 30% and 70% were created for each factor and then were divided into 3 groups:high(h),neutral(N),andlow(L),andthen six groups, BH, BN, BL, SH, SN, and SL, can be obtained by crossing. In investment classification factors were divided into 3 groups based on their asset acquisition pattern: aggressive (A), neutral (N), and conservative (C), and six groups can be obtained by combining small and big such as BA, BN, BC, SA, SN and SC. Each period is then calculated. The market value of each portfolio was divided by the weighted logarithmic return rate and the difference in return rate between the portfolios is finally used asthevalue ofeachfactor.(Raju,2022) MulticollinearityDiagnostics: Before implementing multi-linear regression on the model, we performed various diagnostic tests to ensure the robustness and reliability of the results.
- Variance Inflation Factor (VIF): This was used to identify multicollinearity among the independent variables. A VIF factor above 10 was considered as an indicator of significant multicollinearity.
- Durbin-Watson Statistic: Checked the presence of autocorrelation in the residuals to ensure independence of error terms. Belsley, Kuh and Welsch (BKW) Collinearity Test: This test was employedto
- check the presence of multicollinearity in a more comprehensive way by examining the condition indices and variance decomposition proportions. A condition above 30 indicated potential multicollinearity.
Multilinear Regression: Afterarrangingthe stocks andcheckingthe multicollinearity among all the factors multilinear regression is run for both 3-factor and 5-factor models. The dependent variable is assigned to the Risk-free portfolio returns which were calculated aftersubtractingthereturnsofrisk-freebondsfrom the returns of the portfolio. Independent variables in 3-factormodels are Risk-free Marketreturn (Rm), Small Minus Big (SMB) size-based factor, and High Minus Low(HML)value-basedfactor.
Similarly, for FF5FM along with the 3 factorsmentionedaboveadditional2factorsare taken as independent variables RMW (Robust minus Weak) profitability factor and CMA (Conservative minus Aggressive) investment factor (Table 2). The empirical analysis of the Fama-French Five-Factor Model on the Nifty 500 index for the period November 2019 to October 2024providessomeimportant characteristics of the Indian equity market. The market risk premium (MKT) was the key determinant of portfolio return and had a strong positive and statistically significant relationship. This finds support from previous research and shows that systematic risk is dominant in explaining stock returns in India as specified in
The size factor (SMB) which is supposed to capture the premium of being in small-cap stocks has a minimal impact on returns in the Indian market. The analysis revealed that the coefficientforSMBwasstatisticallyinsignificant, hence the size effect, which is well seen in the developed markets, does not apply to India. However, the value factor (HML) was positively and significantly associated with returns, and thus, the value premium was persistent. Hence, in the Indian market, high book-to-market ratio stocks outperformed their low book-to-market counterparts, which is useful for portfolio construction. A deflection from the global standard was observed in the behavior of the profitability factor (RMW). The profitability factor, however,
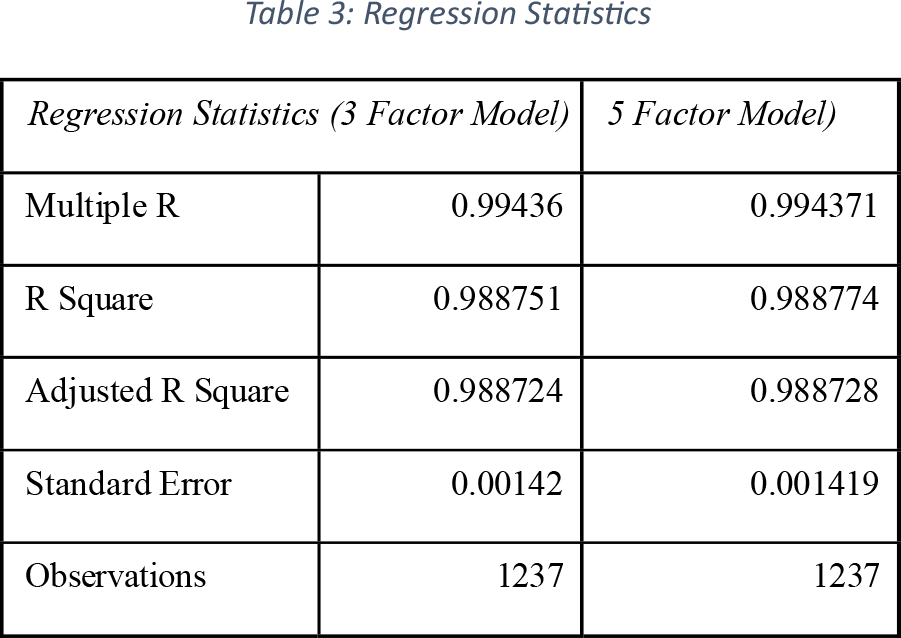
had a negative relationship with portfolio returns, that is, strong profitability has been associated with poor performance in the Indian market. This indicates that there are either certain market dynamics or disorganization in the Indian equity landscape. In addition, the investment factor (CMA) that differentiates between risk and aggressive investment was also found to be statistically not significant, which makes it not useful in explaining stock returns in this case table. The Five-Factor model shows high comprehensiveness, with an AdjustedR-squarevalueof0.989,showcasingits strengths in capturing the variation in the returns, but the additional factors, investment and profitability, don’t add a significant contribution to the model’s explanatory capacity. In comparison, the 3 Factor Model (adjusted R-square of 0.988) performed almost as well, which reflects that the inclusion of 2 additional factors adds only limited practical value intheIndianMarket. These findings underline the dominant influence of the market and value factors while showcasing the limited behavior of size, profitability and investment factors. The results alsoreflectthatwhilethe5-FactorModelshowsa comprehensive framework, its application and uses in the Indian market need more modification to capture the unique characteristics of emerging and growing markets The multicollinearity among all the independent variables was checked to capture the reliability and robustness of the regression results and confirm the independence of all the factors in the Five-Factor Model. This analysis was done with a combination of correlation matrixandVarianceInflationFactor(VIF)testing.
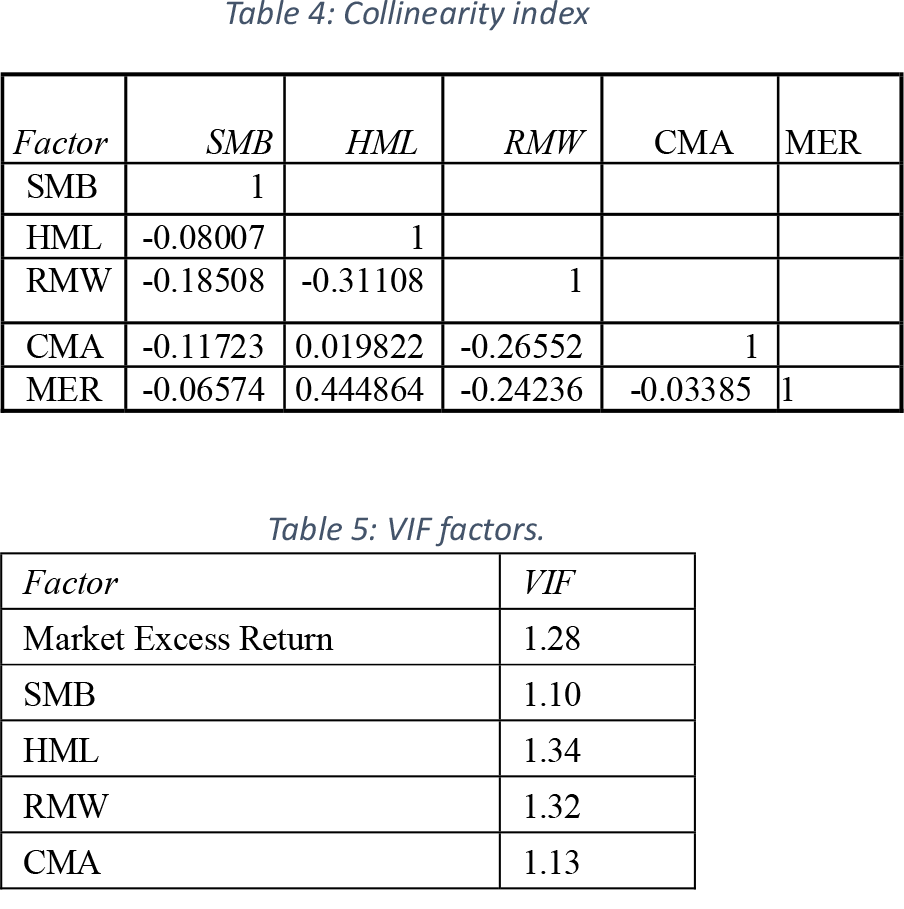
Factor SMB HML RMW CMA MER SMB 1 HML -0.08007 1 RMW -0.18508 -0.31108 1 CMA -0.11723 0.019822 -0.26552 1 MER -0.06574 0.444864 -0.24236 -0.03385 1
Table 5: VIF factors. Factor VIF Market Excess Return 1.28 SMB 1.10 HML 1.34 RMW 1.32 CMA 1.13 Thecorrelationcoefficientsrelationshipina pair of 2 for the factors that is Market Excess Return,SMB,HML,RMW,and CMA,(refertable5) we can conclude that there is a low to moderate correlation among them. Market Excess Return showed weak correlations with all other factors, which signifies its independence as the primary driverofportfolioreturns.Thetable4showsthat the correlations between the factors were minimal. Also, all the values of correlation coefficients are under the accepted upper limit of 0.7, it shows that there is an absence of linear dependence amongallthe independentfactors.
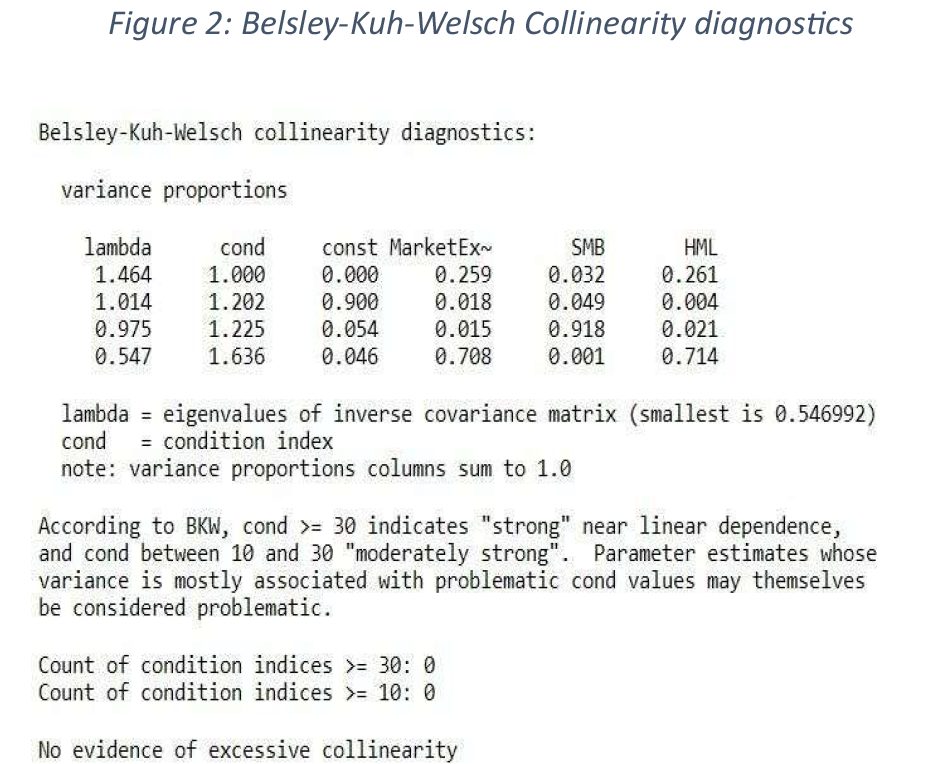
All the VIF values that are shown in table 6 are below the critical threshold of 10, which signifies that multicollinearity is not a major concern among the independent variables. This ensures that the regression coefficients are stable.
Conclusion
This study examines the relevance of the Fama-French Three-Factor and Five-Factor Models in the light of the chosen stock market, which gives a description of how well they work and how the different factors behave. The findings provide a more accurate picture of the strength and weakness of the models in explaining the fluctuations in returns in this market. There are again, positive and significant associations between all the portfolio characteristics and the Market Excess Return (MKT) factor, which confirms its importance in pricing assets. The Value factor (HML) also has a consistent positive significance; this supports the application of value investment strategy, which is in conformity with the global findings. But the study finds that the Size (SMB), Profitability (RMW), and Investment (CMA) factors have significant deviations. The non- significance of SMB contradicts the size effect that is normally present in the developed markets,whilethenegative relationshipof RMW with the returns implies some inefficiencies or peculiaritiesofinvestorsinthismarket.Similarly, the CMA is not significant and hence has no role inexplainingthereturnsinthismarket. The high explanatory power of both the Three- Factor and Five-Factor Models, by Adjusted R- squaredvaluesexceeding0.98,showsthatthey are robust. However, the marginal incremental improvement provided by the Five-Factor ModelhighlightsthattheThree-FactorModelis sufficiently sufficient to capture the primary determinants of returns. These findings indicate that additional factors enrich theoretical understanding, but their practical utilityinthis market is constrained toadditional factors. In conclusion, the application of global asset pricing models in emerging markets requires careful contextualization to account for distinctive economic, structural, and behavioral characteristics. While the Fama- French models provide a strong foundation, localized modifications may be necessary to enhance their predictive accuracy and relevance. Future research should explore alternative methodologies or factor constructions to better align these models with the unique dynamics ofemergingmarkets.
Limitations
Despite the robust findings, this study acknowledges several limitations that should be considered when interpreting the results and applying the Fama-French Five-Factor Modelinthe Indianequitymarket: Factor Construction: The Construction of factors such as SMB, HML, RMW, and CMA has been created while keeping the developed markets, however some of these factors have not been able to show their effectiveness especiallyinemergingmarketslike India. Emerging Market Characteristics: High volatility, investor behaviour and market efficiency of the Indian equity market may restrict the Applicability of the model. This unexpected behaviour of factors such as RMW and CMA not following the global standard couldbeduetothis. Exclusion of Sectoral Dynamics: The Different sectors may have different variations in the
factors, which could affect the overall results hence, we have not considered the sectoral variationswithinthe Nifty500index.However,a sector-specific analysis might provide more detailed insights. Assumption of LinearRelationships:There is an underlying assumption that all these factors share a linear relationship which might not be true, any non-linear relationships might exist between factors and returns which has not beenconsidered inthismodel. Profitability and Investment Factors: The negativeandinsignificantbehaviorofRMWand CMA is a cause for concern regarding their relevance in the Indian equity market. thus there is a need for further investigation to identify the underlying drivers and to look at other measures of profitability and investment thatmayyieldconsistentresults.
References
Ansari, V. C. (2012). Momentum anomaly: Managerial Finance , evidence from India .
Bektic, D. W.-S. (2019). Extending Fama- French Factors to Corporate Bond markets. 45.
Chiah, M. C. (2015). An Empirical Investigation of the Fama-French Five Factor Model in Capital Markets: Asset Pricing Australia. andValuationeJournal,30.
Foye, J. (2017). A comprehensive Test of the FamaFrenchFiveFactormodelinemerging Emerging Markets: Finance markets. ejournal,23.
French, E. F. (2015). Five Factor asset pricing JournalofFinancialEconomies,22. model.
French, F. a. (1993). Common risk factors in the Journal of returns on stocks and bonds. financialEconomics,54.
Hu, G. X. (2019). Fama-French in China: Size and value Factors in Chinese Stock returns. Econometric Modelling: Capital Markets -Asset PricingeJournal,24.
Oleksandr Paliienko, S. N. (2020). An empirical investigation of the Fama French five- factor BusinessPerspective,14. model.
Raju,R. (2022). Market,Four and Five Factor Models SSRN,37. inIndianEquities.
Sehgal, S. S. (2012). A search for Rational sources of stock return anomalies: Evidence from India. Internationaljournalofeconomiesandfinance, 15.
Taneja. (2010).Revisiting Fama French Three Factor The Journal of Model in Indian Stock Market. BusinessPerspective,14.