






Ms. Tanuja B
Research Scholar, University of Mysore
International School of Management Excellence, Research Centre
Bangalore
Email:
tanujab.isme20@gmail.com
Dr. Shampa Nandi
Research Guide, University of Mysore
International School of Management Excellence, Research Centre
Bangalore
Email:
shampa@isme.in
Abstract:
The major objective of this paper is to study the factors related to the Technology-Organisation- Environment (TOE) context that influence the adoption of Digitization in Unorganised Retail Outlets. With this objective, a study of a proposed conceptual model of the TOE framework was taken. To validate the model, a quantitative survey was conducted with unorganized retail outlets in Karnataka, India. The survey generated 75 respondents. AMOS and SPSS were used to access the model. It is observed that the elements related to Technology in the TOE (Technology-Organization-Environment) framework have a major impact on the intention to adopt technology (Digitalisation). However, the mindset of Retailers, which falls under Environment and Organization, needs to be improved to encourage technology adoption intention. The government might utilize the study to promote additional digitalization efforts in rural areas. They can comprehend the needs of rural areas and adapt their work accordingly. Unorganized merchants can utilize this model to expand their customer base and survive in today’s highly competitive market.
JEL Classification: M15, M31
Keywords Unorganised Retailers, TOE framework, Technology, Technology adoption intention.
Introduction
Digitalization is a fundamental and ongoing change in modern civilization that affects all aspects of both business and daily life. This transition is crucial for the retail industry since it has a significant impact on and is influenced by this progress. Retailers offer consumers a range of digital products and services that are designed for use with digital technologies and are influenced by the new patterns of consumption associated with these technologies. Although digitalization has been present in the retail industry for a considerable amount of time, the impact of this shift is becoming more and more apparent. (Salkin, 1964). The development of digitalization is expected to have a profound impact on merchants, consumers, employees, and society as a whole. It is crucial to develop a comprehensive understanding of this phenomenon. (Johan Hagberg et.al., 2016).
The retail industry is highly dynamic and influential worldwide. Moreover, the recent shift in digital technologies remains an exciting opportunity for the Indian retail sector. India is a highly significant retail hub on a global scale, ranking as the fifth-largest destination for retail space worldwide. Indian retail industry has three categories Unorganised retail, Organised retail, and E-Commerce. The Indian retail market is dominated by Unorganised retailers (IBEF, 2021).
The pandemic has driven unorganized retailers to understand the relevance of digital technology usage and their survival in the retail business. The utilization of digital technology improves the consumer experience, minimizes obstacles in the purchasing process, and boosts the profit margin of unorganized businesses. Hence, digital technologies will revolutionize the traditional brick-and-mortar business paradigm into a hybrid physical model. This business strategy improves the user experience beyond the scope of digital payments. (Selvabaskar, 2022).
Regarding declining market share and increasing competition, can these small retail outlets in India effectively manage the growing challenge of digitalization? Traditional retailers, especially small retail establishments, tend to neglect technology and are typically slow in adopting information technologies. (J Hagberg el.al., 2016)
Lastly, small merchants must capitalize on digital payment systems and other digital technologies, such as mobile, social media, and analytics. They also need to redirect their attention towards adaptability and innovative methods of client interaction facilitated by these technologies. (Ravi Seetharaju, 2019)
This study examines the implementation of digital applications in small Unorganised retail establishments in a developing nation such as India. The objective is to assess the adoption and adoption intention of digitization for small unorganized retail establishments and to identify the organizational, technological, and environmental obstacles they encounter.
Literature Review
Customers can make purchases without having to be physically present in a retail store thanks to the current state of internet usage, which provides communication as a mechanism for customers and retailers to communicate with one another. (Nagar K, 2016). A significant amount of demand for technological applications, such as business software packages, has been observed in the field of information systems. To streamline organizational activities, these information systems were initially implemented. (AL-Shboul, 2019). The technology- organization-environment (TOE) framework has been extensively used in various studies of technology application adoption, such as e-commerce (Abualrob, 2016), e-supply and chain (Lin H F, 2014), and e-procurement (Tran et.al., 2014). The retail industry has been forced to supply a varied variety of technological platforms at all levels, which were previously exclusively utilized by large locations in major cities. This is due to the increasing attention that technology developers have been paying to the retail sector. In a developing nation like India, where the service industry is the most prevailing, the retail sector serves as an essential stimulant for economic growth and provides a firm foundation for employment at the national, regional, and local levels. Because of this, the implementation of technological applications in the organized retail sector is something that cannot be ignored, and the development of these applications ought to be a subject of academic investigation in every demographic condition. As a result, the purpose of this research is to address this vacuum by gaining an understanding of how organized retail businesses see their intentions regarding the adoption of innovative technologies. The attention of technology innovators has moved the retail sector to offer them a varied range of advanced platforms at every level, which was previously adopted by large outlets only in metro cities. In a developing economy like India, where the service industry shows dominance, the retail sector acts as a key catalyst for economic growth and forms a strong basis for national, regional, and local employment. Thus, the adoption of technology applications in the organized retail sector cannot be ignored and its development should be an academic point of exploration in all demographic contexts. Hence, this research proposes to
fill this gap by understanding the perceptual level of intention for innovative technology adoption by organized retail outlets. (Anil Kumar, Rohit Singh and swapanrag Swain, 2022).
To gain a better understanding of how businesses embrace new technologies, the research community has made substantial use of the TOE framework. (Albar, 2019) In addition, there has been a presence in the literature concerning the role that the government plays in the adoption of websites for businesses. (Osakwe, 2016) The purpose of these studies was to evaluate the impact that the adoption of technology or any new technology will have on businesses. Both good and negative assessments of the adoption of technology may be found in the literature. (Lin H F, 2014). The implementation of technology that is based on the Internet can confer a variety of advantages on a business (Perez-Gonzalez, 2018). Based on the results of the cost-benefit analysis, businesses can determine whether or not the adoption of Technology 4 Global Business Review is beneficial, and they are motivated to embrace it if it is beneficial. (Raymond F, 2008). The threat from its competitors is also the reason to adopt technology because of its potential to make business operations better (Teo T S el.al., 2009) In underdeveloped countries, the government has a crucial role in promoting the adoption of technology by implementing uncomplicated and favorable laws and regulations for businesses. (Chatzoglou D Chatzoudes P, 2016).
There have been numerous academics who have investigated the ramifications of the TOE framework about various digital applications; however, just a few of them have been emphasized here. The effects of TOE variables on accounting information systems were the subject of research that Lutfi and colleagues carried out in the year 2020. Matias and Hernandez conducted research in 2019 on the factors that influence the adoption of cloud computing by micro, small, and medium-sized enterprises (MSME). On the other hand, AlBar and Hoque (2019) researched the adoption of ERP, while Sandu and Gide (2018) investigated the use of cloud-based services by small and medium-sized enterprises (SMEs) in India. During the year 2018, Bhattacharya and Wamba made a significant contribution to the retail business by determining the factors that influence the implementation of Radio Frequency Identification Technology (RFID) in a retail environment. Jia et al. reviewed the elements that had an impact on E2.0 after it was adopted in the year 2017. A study conducted by Karkonasasi (2016) investigated the elements that influence the adoption of cloud computing in enterprises. Gangwar et al. conducted research that led to the discovery of the TOE framework and the technology adoption mode. Between the years 2022 and 2023, Anil Kumar carried out a study
Research Gap:
The Present literature states that adaptation of digitalization is important for today’s business and focusing on the area of Rural Unorganised Retailing no such study has been taken up.
The Objective of the Study:
- To study the TOE model with reference to the adoption of digitalization by Rural Unorganised Retailers.
Conceptual Model
The TOE framework was conceptualized based on previous insights. The model consists of Technological Context – where it elaborates on the new and existing technology used for the market by the firm. Organizational Context – IT defines the firm’s size and scope of business. Environmental Context – Its related to external factors of the firm such as government, competitors, etc., and Technology adoption Intention – shows the process by which technology is adopted (T Oliveira, 2011)
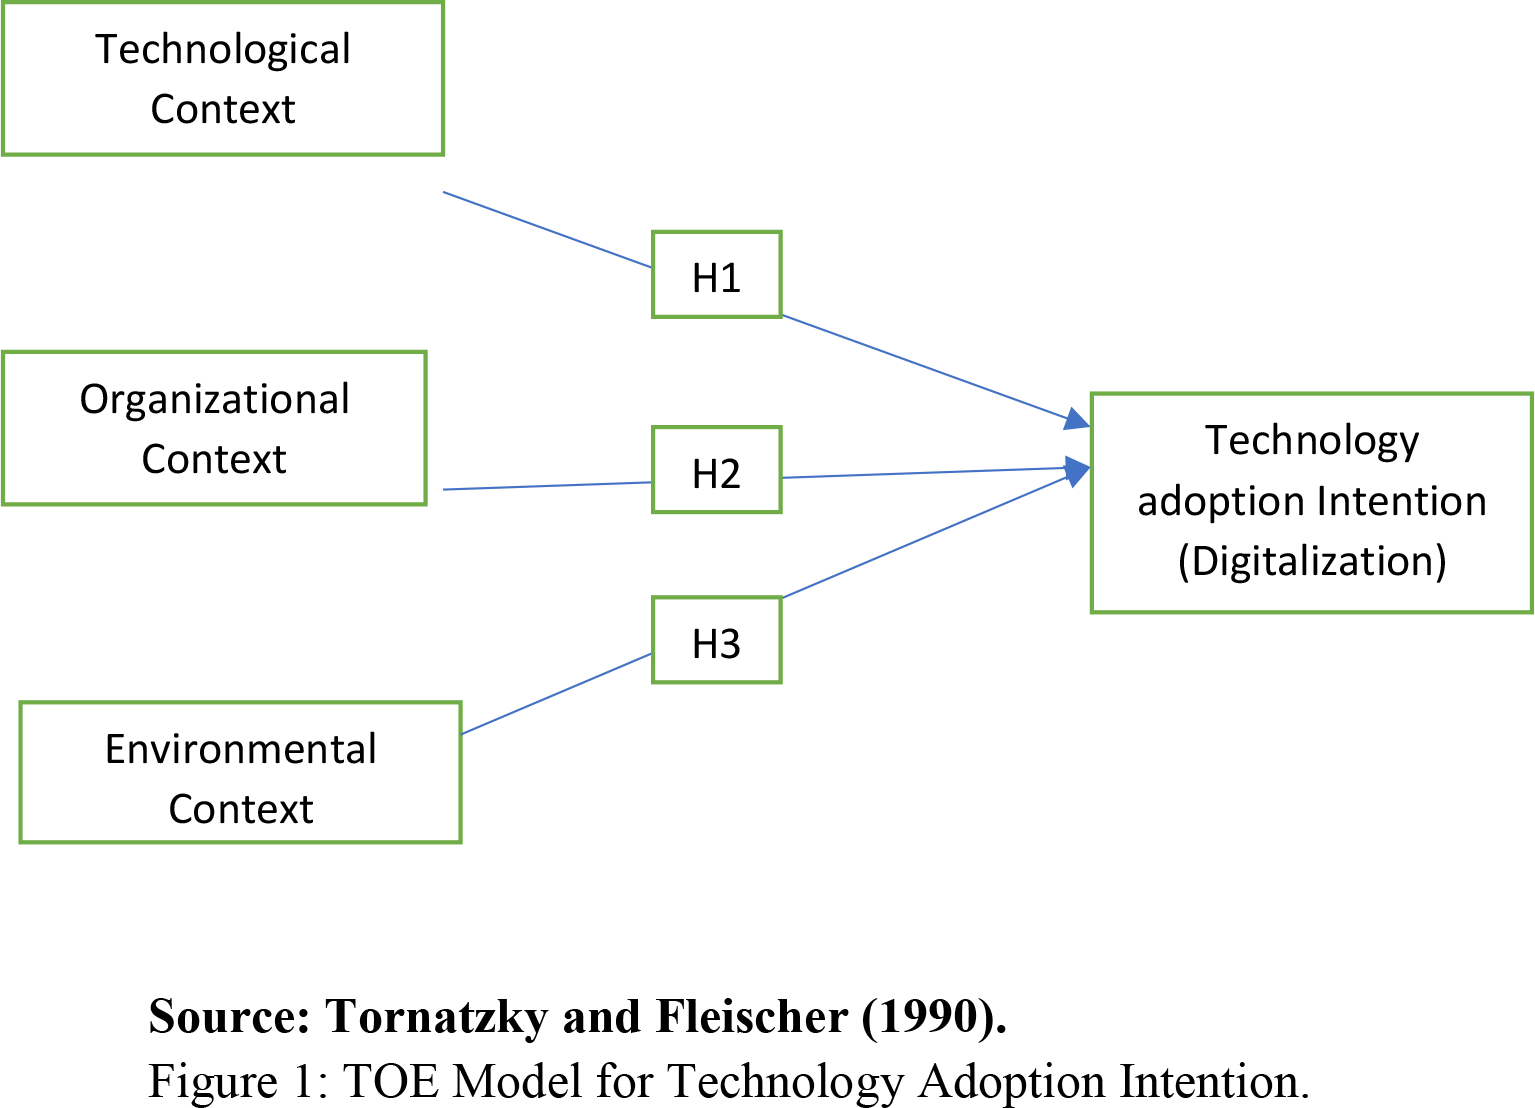
Source: Tornatzky and Fleischer (1990). Figure 1: TOE Model for Technology Adoption Intention.
Research Hypothesis
H1: There is a significant and positive relationship between Technological Context and Technology Adoption Intention in unorganized retail outlets in rural areas.
H2: There is a significant and positive relationship between Organizational Context and Technology Adoption Intention in unorganized retail outlets in rural areas.
H3: There is a significant and positive relationship between Environmental Context and Technology Adoption Intention in unorganized retail outlets in rural areas.
Research Methodology
The study aims to explore the relationship between the Technology Adoption Intention of Digitalization and the three Contexts of the TOE framework i.e. Technology, Organisation, and Environment with reference to Unorganised Retailers in Rural Areas. To study the four constructs and their relation SPSS and AMOS were used. AMOS helps to estimate models with small sample sizes and a large number of variables and indicators
Scale
In order to accomplish the objectives, a questionnaire was designed and a survey-based approach was employed. The questionnaire comprised multiple valid instruments. The perception of the respondents was measured using a Five-point Likert Scale. 1 represents Strongly Disagree and 5 represents Strongly Agree. The questionnaire used was pre-validated (Swain, 2022). The questionnaire was validated by the application of Factor Analysis, and the data was further validated by computing the figures using AMOS.
Sample size
Overall 14 variables were taken for the study on technology, organization, and Environment, based on the Tumb rule the required sample size was calculated on 5 times the variables taken for the study which is 70. Therefore, the study’s sample consists of 75 retailers. The samples were collected from unorganized retailers in rural areas of North Karnataka, India, with a special focus on Hubli, which is recognized as a major commercial Hub in Karnataka. The Retailers were individually interviewed and the questionnaire was thoroughly discussed and completed by the team. The population was divided into clusters, each city in North Karnataka was considered a cluster, and a Judgmental sampling technique was employed to pick the
respondents. The respondents were judged on the type of retail shops and only shops with Grocery product sales were taken for the study. The participants were guaranteed confidentiality to incentivize their participation in the survey.
Results
The Demographic Data used for the survey are analysed for the study are mentioned below
GENDER
| Frequency | Percent | Valid Percent | Cumulative Percent | ||
|---|---|---|---|---|---|
| Valid | Female | 11 | 14.7 | 14.7 | 14.7 |
| Male | 64 | 85.3 | 85.3 | 100.0 | |
| Total | 75 | 100.0 | 100.0 |
Table: 1 – Gender wise distribution of Rural Retailers Respondents
In the study, 85.3% are male respondents and 14.7 % are female.
AGE
| Frequency | Percent | Valid Percent | Cumulative Percent | ||
|---|---|---|---|---|---|
| Valid | < 20 years | 5 | 6.7 | 6.7 | 6.7 |
| > 50 years | 12 | 16.0 | 16.0 | 22.7 | |
| 21 – 35 years | 18 | 24.0 | 24.0 | 46.7 | |
| 36 – 50 years | 40 | 53.3 | 53.3 | 100.0 | |
| Total | 75 | 100.0 | 100.0 |
Table: 2 – Age-wise distribution of Rural Retailers Respondents
The Age of the respondents was divided into 4 categories of which 6.7% were < 20 years old and looking after the retail outlet. 24% were between 21 to 35. 53.3% were in the age group of 36 –50 and 16% were above 50 years. More than 50% of the respondents fall under the age group of 36 –50 for the study.
EDUCATION
| Frequency | Percent | Valid Percent | Cumulative Percent | ||
|---|---|---|---|---|---|
| Valid | Graduate | 17 | 22.7 | 22.7 | 22.7 |
| High School | 39 | 52.0 | 52.0 | 74.7 | |
| Primary Schooling | 19 | 25.3 | 25.3 | 100.0 | |
| Total | 75 | 100.0 | 100.0 |
Table: 3 – Education-wise distribution of Rural Retailers Respondents
The education level of the respondents was also studied for the adoption of digitalization th th where 25.3% were primary schooling up to 8 standard. 52% had completed till 12 that is PUC and 22.7% were Graduates.
Avg. Monthly Revenue
| Frequency | Percent | Valid Percent | Cumulative Percent | ||
|---|---|---|---|---|---|
| Valid | < 10000 | 40 | 53.3 | 53.3 | 53.3 |
| 10000 – <25000 | 32 | 42.7 | 42.7 | 96.0 | |
| 25000 – < 50000 | 3 | 4.0 | 4.0 | 100.0 | |
| Total | 75 | 100.0 | 100.0 |
Table: 4 – Income-wise distribution of Rural Retailers Respondents
The average monthly revenue of the respondents taken for the study was 53.3% earning less than 10000. 42.7% fall in the bracket of 10000 to 25000 and only $% are from 25000 to 50000.
Digital apps in your business
| Frequency | Percent | Valid Percent | Cumulative Percent | ||
|---|---|---|---|---|---|
| Valid | No | 27 | 36.0 | 36.0 | 36.0 |
| Yes | 48 | 64.0 | 64.0 | 100.0 | |
| Total | 75 | 100.0 | 100.0 |
Table: 5 – Digital Apps Used by Rural Retailers Respondents in Business.
Further information, was analyzed if they are using digital apps for their business. of which 64% are already using digital apps for their business and 36% are yet to adopt it.
Apps used in your current business.
| Frequency | Percent | Valid Percent | Cumulative Percent | ||
|---|---|---|---|---|---|
| Valid | Google Pay | 1 | 1.3 | 1.3 | 1.3 |
| None | 27 | 36.0 | 36.0 | 37.3 | |
| PayTM | 13 | 17.3 | 17.3 | 54.7 | |
| Phone Pe | 25 | 33.3 | 33.3 | 88.0 | |
| Phone Pe, Google Pay | 1 | 1.3 | 1.3 | 89.3 | |
| Phone Pe, PayTM | 3 | 4.0 | 4.0 | 93.3 | |
| Phone Pe, PayTM, Google Pay | 5 | 6.7 | 6.7 | 100.0 | |
| Total | 75 | 100.0 | 100.0 |
Table: 6 – Payment Apps Used in Business by Rural Retailers Respondents
To know the kind of application used multiple choice was given as few use more than one app for payments. It was found that 1.3% used only Google Pay. 17.3% used Paytm, and 33.3% had PhonePe. A few respondents use more than one app for payments, it was found that 1.3 % use PhonePe and Google Pay, 4% use PhonePe and Paytm, and 6.7% use three applications such as PhonePe, Paytm, and Google Pay.
The measurement model.
To analyze the loading of each contrast Factor analysis was executed. The items that fall below 0.5 in loading have to be discarded. The process was done until all loading fell under the same component and had a value > 0.5. KMO and Bartlett’s test was calculated at 0.875. The cumulative factor analysis stands at 70.198.
Exploratory Factor Analysis
Rotated Component Matrix
| Component | ||||
|---|---|---|---|---|
| 1 | 2 | 3 | 4 | |
| TAI4 | .815 | .061 | .173 | .168 |
| TAI5 | .809 | .117 | .153 | .146 |
| TAI1 | .801 | .148 | .155 | .230 |
| TAI6 | .797 | .290 | .210 | .161 |
| TAI2 | .715 | .140 | .196 | .311 |
| TAI3 | .689 | .138 | .109 | .380 |
| EC1 | .113 | .910 | -.060 | -.017 |
| EC3 | .265 | .832 | .044 | .229 |
| EC4 | .034 | .746 | .281 | .287 |
| EC2 | .104 | .595 | .246 | .488 |
| EC5 | .338 | .589 | .396 | .107 |
| OC3 | .169 | .282 | .763 | .060 |
| OC1 | .347 | -.128 | .754 | .145 |
| OC4 | .059 | .063 | .739 | .255 |
| OC6 | .446 | .378 | .547 | .081 |
| OC8 | .191 | .290 | .539 | .405 |
| TC1 | .288 | .149 | .133 | .769 |
| TC4 | .469 | .199 | .243 | .669 |
| TC3 | .397 | .364 | .196 | .639 |
| TC2 | .447 | .071 | .304 | .552 |
Extraction Method: Principal Component Analysis
Table: 7 – Exploratory Factor Analysis, Factor Loadings.
An exploratory factor analysis was performed on the dataset comprising many variables. The variable was examined, and those with a value less than 0.5 were excluded from the study.
Table 7 displays the variables that met the criteria of being more than 0.5 and were selected for further investigation.
KMO and Bartlett’s Test
| Kaiser-Meyer-Olkin Measure of Sampling Adequacy. | .875 |
| Bartlett’s Test of Sphericity — Approx. Chi-Square | 1042.277 |
| Bartlett’s Test of Sphericity — Df | 190 |
| Bartlett’s Test of Sphericity — Sig. | .000 |
Table: 8 – KMO and Bartlett’s Test
Convergent Validity
According to Fornell and Larcker (1981), convergent validity ensures that the components of each construct are exclusively associated with that construct and not with any other constructs. Convergent validity is evaluated using Average Variance Extracted (AVE), Cronbach’s alpha, and CR. As per the studies conducted by Hair et al. (2014) and Henseler et al. (2009), it is suggested that the threshold values for CR and Cronbach’s Alpha should be >0.70 and >0.5, respectively, for AVE. Given that all of the cut-off values are above the recommended standards, the build reliability has been established.
Convergent Validity
| Constructs | Items | Loadings | Cronbach’s Alpha | CR | AVE | Mean | Std. Deviation |
|---|---|---|---|---|---|---|---|
| Environmental Context | EC1 | .763 | .877 | 0.879 | 0.596 | 2.816 | 1.2109 |
| EC2 | .736 | ||||||
| EC3 | .879 | ||||||
| EC4 | .779 | ||||||
| EC5 | .691 | ||||||
| Organisational Context | OC1 | .609 | .819 | 0.817 | 0.476 | 3.03 | 1.1536 |
| OC3 | .759 | ||||||
| OC4 | .566 | ||||||
| OC6 | .787 | ||||||
| OC8 | .704 | ||||||
| Technological Context | TC1 | .738 | .870 | 0.874 | 0.637 | 3.14 | 1.234 |
| TC2 | .717 | ||||||
| TC3 | .854 | ||||||
| TC4 | .872 | ||||||
| Technology Adoption Intention | TAI1 | .790 | .918 | 0.898 | 0.590 | 3.26 | 1.2144 |
| TAI2 | .773 | ||||||
| TAI3 | .722 | ||||||
| TAI4 | .753 | ||||||
| TAI5 | .759 | ||||||
| TAI6 | .830 |
Source: Author
Table: 8 – Convergent Validity
The establishment of convergent validity for the datasets was necessary. The calculation of Cronbach’s Alpha was performed. The Cronbach’s Alpha values for all four constructs are satisfactory. The EC score is 0.877, the OC score is 0.819, the TC score is 0.870, and the TAI score is 0.918. The dataset’s Composite Reliability should exceed 0.7. The Composite Reliability of each construct exceeds the specified threshold. The values for EC, OC, TC, and TAI are 0.879, 0.817, 0.874, and 0.898 respectively. The AVE value must be greater than 0.5. The EC has a value of 0.596, the TC has a value of 0.637, and the TAI has a value of 0.590. Only the OC has a value less than 0.5, specifically 0.476, which is not considered very
low. Mean and Standard Deviation for the data sets were calculated. Therefore, the establishment of convergent validity has been confirmed.
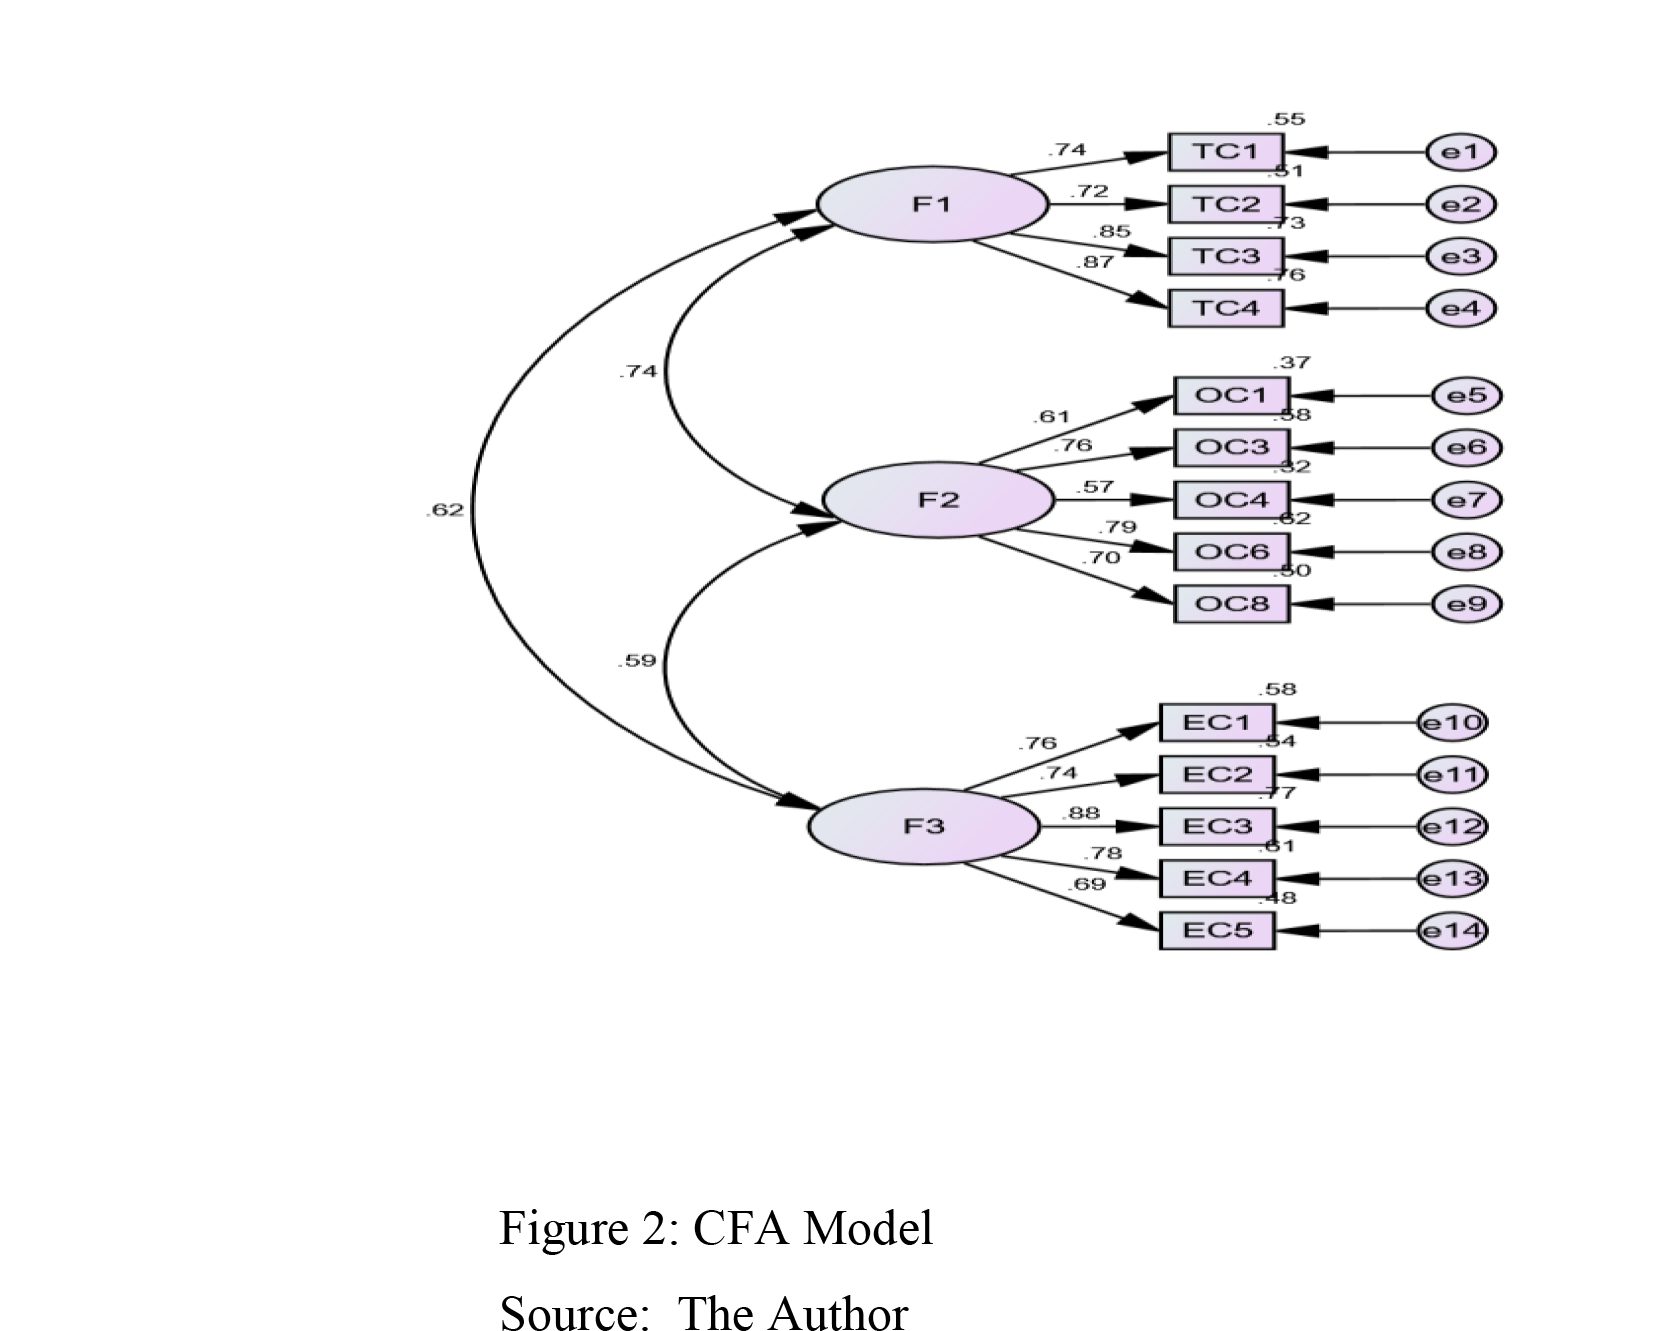
Figure 2: CFA Model
Source: The Author
Divergent validity:
To calculate divergent validity calculations of AVE, ASV, and MSV were done. Consequently, the AVE value is calculated to assess the divergent validity. Divergent validity assesses the extent to which a particular concept is distinct from other concepts (Hulland, 1999). The values were established with the help of AMOS.
| AVE | ASV | MSV | AVE>ASV | AVE>MSV | |
|---|---|---|---|---|---|
| TC | 0.637 | 0.464 | 0.5476 | AVE > ASV | AVE > MSV |
| OC | 0.476 | 0.442 | 0.5476 | AVE > ASV | AVE< MSV |
| EC | 0.596 | 0.366 | 0.3844 | AVE > ASV | AVE > MSV |
Table 10: Divergent Validity
Source: Author
The divergent validity has been established in the Technological Context and Environmental Context. Even if divergent validity has not been established in an Organisational Context the results are not that bad. Overall the Divergent validity established among the three contracts is good.
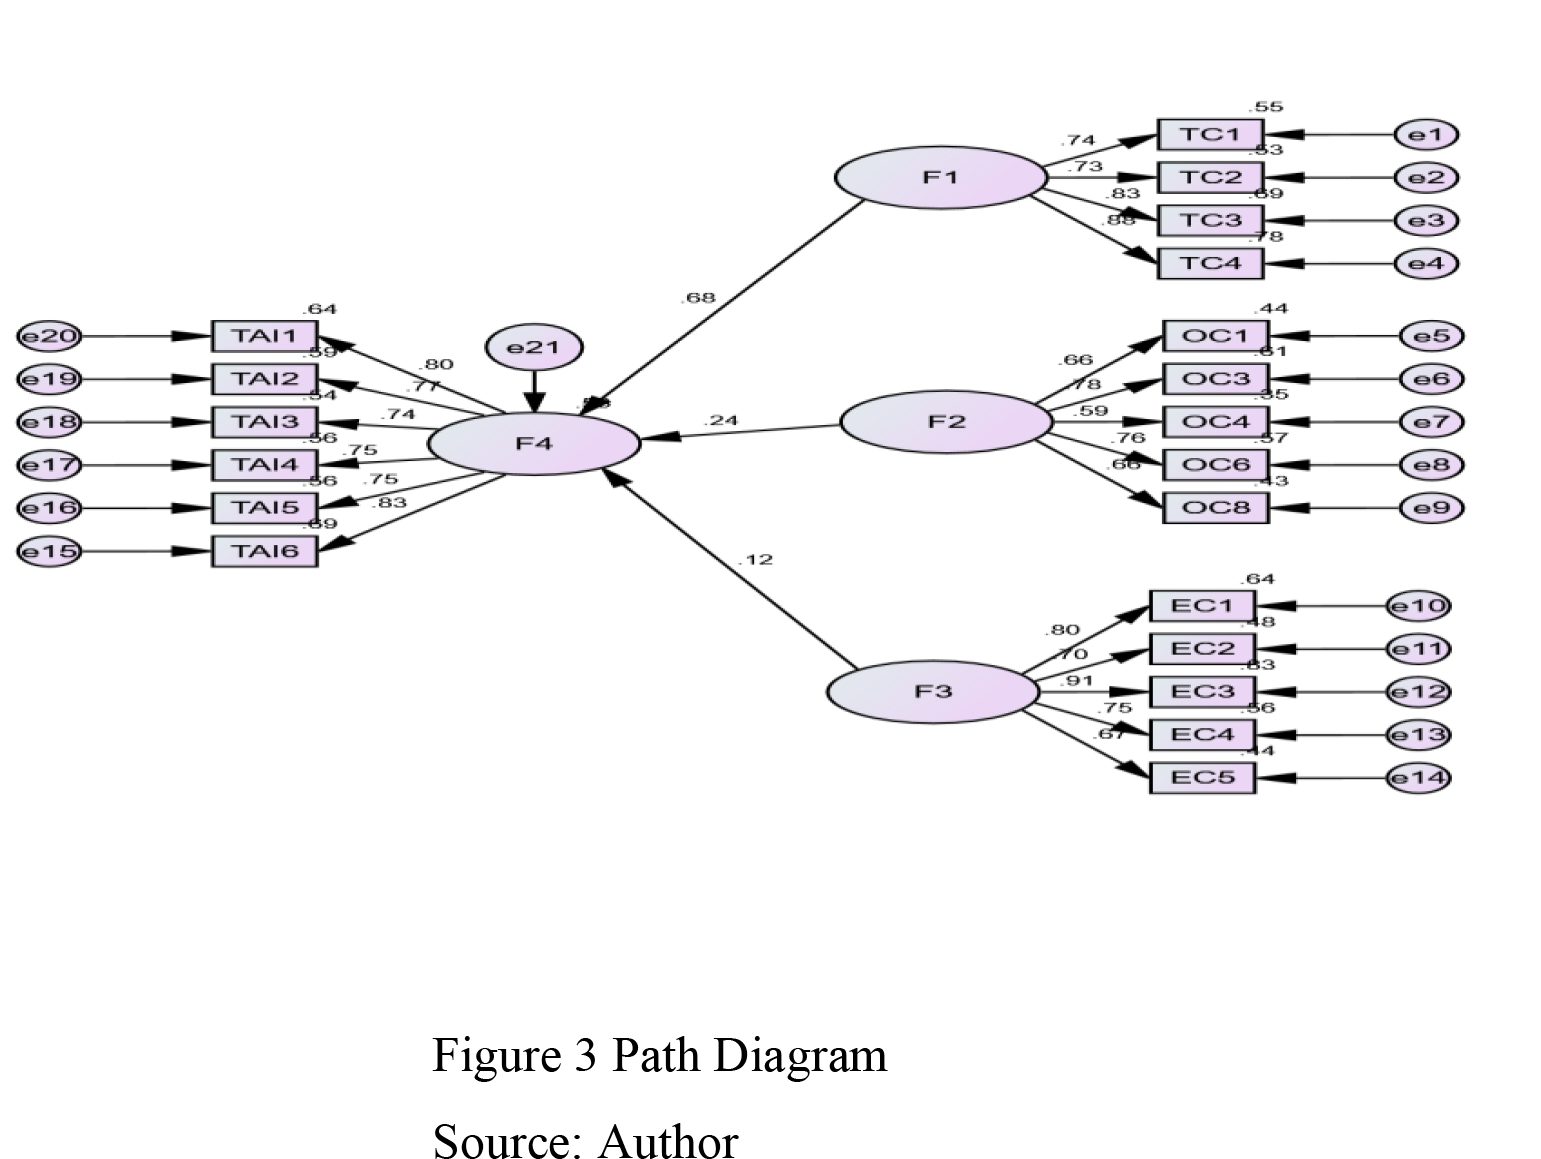
Figure 3 Path Diagram
Source: Author
Hypothesis Results
| Hypothesis | Path | Path Coefficients (β) | t-Statistics | p-Values | Results |
|---|---|---|---|---|---|
| H1 | Technological Context -> Technology adoption intention | 0.676 | 0.138 | *** | Null Hypothesis is Rejected |
| H2 | Organisational Context -> Technology adoption intention | 0.238 | 0.136 | 0.029 | Null Hypothesis is Rejected |
| H3 | Environmental Context -> Technology adoption intention | 0.119 | 0.101 | 0.229 | Null Hypothesis is not Rejected |
Table 11: Hypothesis Path Results
Source: The Author
Discussion
The study investigates how the TOE framework’s components affect the intention to adopt technology that is digitalization. The three constructs TOE model that is Technology, Environment, and Organization are utilized to examine the Technology Adoption Intention of digitalization in Unorganized Rural Retailers. There are five variables in the environment context, Four in the technology context, five in the organizational context, and six in the technology adoption intention. Table 11 illustrates how Technology Adoption Intention is significantly and favorably impacted by both Organizational Context and Technological Contexts. Conversely, the intention to adopt technology is not significantly and favorably impacted by the environmental context.
Hypothesis 1 states that the technological Context has a significant and positive impact on the adoption of technology that is digitalization in Rural Unorganised Retailers. The Unorganised Rural Retailers are aware of the significant role that technology plays in business and are prepared to embrace it. The variable examined in this research within a technology framework is the identification of new business prospects. Retailers acknowledge the presence of such opportunities. Technology enhances corporate efficiency by reducing costs. The primary variable being enhanced is the customer relationship in business, which is crucial for the longevity of the business. Multiple studies cited in the literature review also support the same conclusion.
Hypothesis 2 the Organisational context has a significant and positive impact on the adoption of technology that is digitalisation in Rural Unorganised Retailers. Retailers are aware of the significance of digitalization in the business sector. The variables tested in the paper with reference to organization are if the rural unorganized retailers have enough funds to adopt technology, it was seen that with funds they also give priority to the adoption of technology. They anticipate government assistance in the implementation of technology. Distributors consistently promote the adoption of digitalization to them. They have come to realize that embracing and incorporating technology is a crucial asset that aids in the sustainability of rural retail businesses. Retailers are actively embracing technology with the assistance of the government and receiving fundamental training. The prior study in the literature review specifically examines the organizational setting in relation to the adoption of digitalization.
Hypothesis 3 It is seen that the Environmental context has no significant and positive impact on the adoption of technology that is digitalization in Rural Unorganised Retailing. Evidence
suggests that the rural environment has no impact on the adoption of digitalization. The variables examined in the study are that Rural Retailers will lose customers if they do not adopt digitalization. Are the technology vendors providing training on the adoption of technology? It also studies if technology is essential in today’s business and our customers do go through promotions on social media apps like WhatsApp and Facebook. It has also studied if the additional applications for payments and accounts are helpful. The environmental context does not appear to have an influence on technological adoption (digitalization). The environment is not favorable to the adoption of digitalization concepts.
Thus, the study shows that only technological advantage and retailers’ intention to adopt technology have a beneficial impact on adoption, even in surroundings that do not support it. The study also revealed that retailers have a desire to implement new practices, but the current service environment is not conducive to their efforts.
Conclusion
Technology Adoption Intention is a well-informed phenomenon that involves the proposal of numerous models. This research has focused on three specific scenarios for the investigation, utilizing the TOE framework. The results indicate that within the TOE framework, only Technology and Organisation have a positive relationship, while the Environment in which Unorganised Retailers operate their business is not significant.
Previous research indicates that technology is crucial in gaining a competitive advantage. However, the examination of Unorganised retailing has not produced significant outcomes in terms of gaining a competitive edge. The study can assist unorganized retailers in implementing technology in their businesses to ensure their survival. The government can comprehend the challenges encountered by rural unorganized retailers when it comes to embracing technology. The system developers can discern the challenges encountered by rural unorganized retailers and adapt their efforts accordingly. The study demonstrates that unorganized merchants exhibit a strong inclination towards and awareness of integrating technology into their business operations.
Limitations
Every study inevitably has limitations, and one such limitation that can arise is the constraint of time. The study exclusively concentrates on the state of Karnataka, rather than encompassing the entire country. To enhance comprehension of the study, moderating variables can be employed, such as ensuring accessibility and providing education to shops regarding their utilization. Subsequently, the study can be further pursued. A longitudinal study is particularly favored, particularly in the context of Rural Unorganised Retailing, to cultivate awareness. The preceding study primarily examines the utilization of several applications in the context of Organised Retailing. The study could benefit from a larger sample size or by analyzing samples from different clusters.
Managerial Implications.
The sellers or the manufacturers who are struggling hard to enter the rural market should study the requirements of rural retailers to help them adopt the technology by creating educational programs for retailers and adopting the “Click and Brick” model for the distribution of goods.
The market needs to adopt new ways to reach and promote the goods to rural consumers. The market should not demand more online as consumers believe retailers more than online products.
Retailers should be encouraged to adopt digitalization as it is the need of the hour for survival. Government should provide more training programs and facilities for adoption of sdigitalisation.
References:
- Abualrob, A. A. (2016). The barriers that hinder the adoption of e-commerce by small businesses: Unique hindrance in Palestine. Information Development, 32(5), 1528-1544.
- Albar, A. M. (2019). Factors affecting cloud ERP adoption in Saudi Arabia: An empirical study. Information Development, 35(1), 150-164.
- AL-Shboul, M. A. (2019). Towards a better understanding of determinants logistical factors in SMEs for cloud ERP adoption in developing economies. Business Process Management Journal, 25(5), 250-275.
- Anil Kumar, Rohit Singh, and swapanrag Swain. (2022). Global Business Review, 1-24.
- Baker, J. (2011). The Technology-Organisation-Environment Framework. ResearchGate. doi:https://www.researchgate.net/publication/226145805
- Chatzoglou D Chatzoudes P. (2016). Factors affecting e-business adoption in SMEs: An empirical research. Journal of Enterprise Information Management,, 29(3), 327-358.
- Chopra, K. (2017, March). Attitude of unorganized retailers towards mobile payments. International Journal of Research IT and Management, 7(3), 95-100.
- Darko, M. V. (2022, June 29). A Revised Technology-Organisation-Environment Framework for Brick-and-Mortar Retailers Adopting M-Commerce. Journal of Risk and Financial Management. doi:https://doi.org/10.3390/jrfm15070289
- IBEF. (2021). Indian retail industry report”. New Delhi: IBEF.
- J Hagberg el.al. (2016). The Digitalization of Retailing: An Exploratory Framework. International Journal of Retail Distribution Management, 44(7), 694-712.
- Johan Hagberg et.al. (2016). The digitalization of retailing: an exploratory framework. International Journal of Retail and Distribution Management, 44(7).
- Karthink_Ram, S. S. (2022). Digital Technology Adoption and its Usage among Unorganised Retailers. Interdisciplinary Research in Technology and Management. doi:10.1109/IRTM54583.2022.9791591
- Lars Bollweg et.al. (2016). Digitalization of Local Owner Operated Retail Outlets: The Tole of the Perception of Competition and Customer Expectation. Pacific Asia Conference of Information System. Retrieved from http://aisel.aisnet.org/pacis2016/348
- Lin H F. (2014). Understanding the determinants of electronic supply chain management system adoption: Using the technology–organization–environment framework. Technological Forecasting and Social Change, 86, 80-92.
- M Karthik Ramet. al. (2023, January 14). Mobile application adoption in business by the unorganized retailers and expanding the constructs by using TAM, DOI and TOE theories. Management Science Letters, 13, 96-107. doi:doi: 10.5267/j.msl.2023.2.001
- Mishra, P. G. (2009). Would Indian consumers move from Kirana stores to organized retailers when shopping for groceries? Asia Pacific Journal of Marketing and Logistics, 21(1). doi:http://dx.doi.org/10.1108/13555850910926281
- Nagar K. (2016). Drivers of E-store patronage intentions: Choice overload, Internet shopping anxiety, and impulse purchase tendency. Journal of Internet Commerce, 15(2), 97-124.
- Osakwe, C. N. (2016). Can micro-enterprises leverage on the adoption of corporate websites to bolster their brand visibility? Examining salient adoption issues in Nigeria. Information Development,, 32(4), 904-919.
- P K Sinha, S. G. (2015). Online Retailing Paired with Kirana – A formidable Combination for Emerging Markets. Cust. Need and Solut, 317-324. doi:DOI 10.1007/s40547-015-0057-9
- Perez-Gonzalez, P. S.-A. (2018). An investigation of the effect of electronic business on financial performance of Spanish manufacturing SMEs. Technological Forecasting and Social Change, 136, 355-362.
- Ravi Seethamraju, K. S. (2019). Digitalization of Small Retail Stores – Challenges in Digital Payments. Proceedings of the 52nd Hawaii International Conference on System Sciences (pp. 5175 – 5184). Scholar Space. Retrieved from https://hdl.handle.net/10125/59954
- Ravi Seetharaju, K. S. (2019). Digitalization of Small Retail Stores – Challenges in Digital Payments. 52nd Hawaii International Conference on System Sciences (pp. 5175 – 5184). 52nd Hawaii International Conference. Retrieved from URI: https://hdl.handle.net/10125/59954
- Raymond F, L. B. (2008). Enabling the business strategy of SMEs through e-business capabilities. Industrial Management and Data Systems, 108(5), 577-595.
- Salkin, L. E. (1964). Linear Programming for merchandising decisions. Journal of Retailing, 40(4), 37-59.
- Selvabaskar, M. K. (2022). Digital Technology Adoption and its Usage among Unorganised Retailers. IEEE.
- Swain, A. K. (2022). Adoption of Technology Applications in Organized Retail Outlets in India: A TOE Model. Global Business Review. doi:DOI: 10.1177/09721509211072382
- T Oliveira, M. F. (2011). Literature Review of information technology adoption models at firm level. Electronic Journal of Information Systems Evaluation, 14(1), 110-115.
- Teo T S el.al. (2009). Adopters and non-adopters of e-procurement in Singapore: an empirical study. Omega, 37(5), 972-987.
- Tran et.al. (2014). Initial adoption versus institutionalization of e-procurement in construction firms: An empirical investigation in Vietnam. Journal of Global Information Technology Management, 17(2), 91-116.