


Dr. Purnajit Chatterjee, HOD — External Linkages, International School of
Management Excellence (ISME)
1. Course: Operations Management
2. Concepts/Theories: Statistical Process Control, understand the importance of Control
Charts. How to build X-Bar Charts and R-Charts and measure Process Capability.
3. Teaching Note: This Caselet teaches students about a real life situation in the
manufacturing industry, analysis of realistic sample data and building X-Bar Charts
and R-Charts and determining whether the process is under control or not, measuring
Process Capability and the probability of defects occurring with existing
manufacturing set-up and processes.
Introduction
BreezeTech Industries Pvt. Ltd. is a mid-sized manufacturer of electric motors for ceiling fans, based
in Pune, India. The company supplies motors to major fan brands under OEM contracts and faces
intense competition from domestic and Chinese manufacturers. To sustain its market share,
management has prioritized quality improvement and operational excellence.
Over the past year, BreezeTech received multiple customer complaints regarding motor vibration,
noise, and overheating, leading to increased warranty claims. Root-cause analysis indicated excessive
variability in the armature winding process and bearing assembly tolerances. In response, the
company adopted Statistical Process Control (SPC) as part of its Total Quality Management (TQM)
initiative.
The Quality Manager, together with the Operations team, introduced control charts, process capability
analysis, and defect measurement tools to monitor key production processes. This case focuses on the
implementation of SPC for the stator winding thickness, which directly influences motor efficiency,
noise, and vibration.
Manufacturing Process
The production of a ceiling fan motor at BreezeTech involves the following steps:
- Stamping of laminations
- Stacking and pressing laminations into the stator core
- Winding of copper wire on the stator
- Insertion of rotor and shaft assembly
- Bearing fitment and lubrication
- Balancing test and final inspection.
The critical dimension studied is the stator winding thickness (in millimetres), measured at three
points around the stator for each motor and averaged. This characteristic is Critical-to-Quality
(CTQ) because:
- Too small thickness → loose winding → lower efficiency and potential vibration.
- Too large thickness → overly tight winding → increased noise and possible coil burnout.
- Engineering tolerance: target thickness T=15.0 mm with tolerance ±0.3 mm.
- Lower specification limit: LSL= 14.7 mm
- Upper specification limit: USL=15.3 mm
- Process objective: keep winding thickness close to 15.0mm with low variability.
Data Collection
Over one week, data were collected in subgroups of size n=4 motors, forming k=25 samples. For this case, the
first 10 subgroups are analyzed. For each motor, the average winding thickness (in mm) is recorded.
Raw Data (First 10 Samples, n=4)
| Sample | Motor 1 | Motor 2 | Motor 3 | Motor 4 |
| 1 | 14.9 | 15.1 | 15.0 | 14.8 |
| 2 | 15.1 | 15.2 | 14.9 | 15.0 |
| 3 | 15.3 | 15.1 | 15.2 | 15.0 |
| 4 | 15.2 | 15.1 | 15.0 | 14.9 |
| 5 | 14.8 | 14.9 | 15.0 | 15.1 |
| 6 | 15.0 | 14.9 | 15.2 | 15.1 |
| 7 | 15.1 | 15.0 | 14.8 | 14.9 |
| 8 | 15.2 | 15.3 | 15.1 | 15.0 |
| 9 | 14.9 | 15.0 | 15.1 | 15.2 |
| 10 | 15.0 | 14.9 | 15.0 | 15.1 |
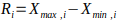
For each sample i , the subgroup mean Xi and range Ri are computed and used to construct X- and R- charts.
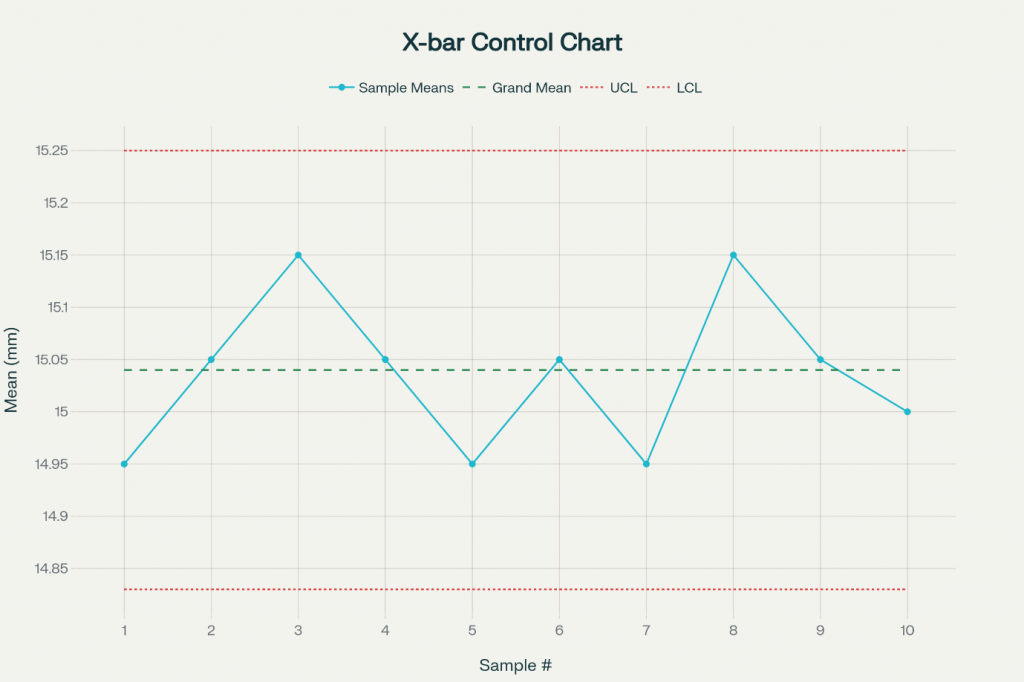
Problem 1: Constructing X and R Charts
Using the 10 samples provided (each with n=4 ), compute:
a) Grand mean X
b) Average range R
c) Control limits for the X -chart
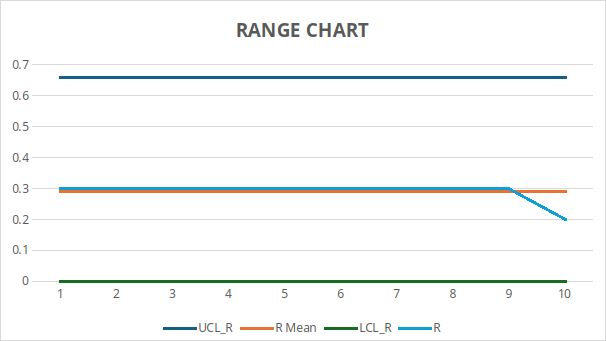
d) Control limits for the R -chart
Solution 1
Step 1: Subgroup means and ranges
For each sample :
- Subgroup Mean :
- Range :
Using the data:
| Sample | (mm) | (mm) |
| 1 | 0.30 | |
| 2 | 15.05 | 0.30 |
| 3 | 15.15 | 0.30 |
| 4 | 15.05 | 0.30 |
| 5 | 14.95 | 0.30 |
| 6 | 15.05 | 0.30 |
| 7 | 14.95 | 0.30 |
| 8 | 15.15 | 0.30 |
| 9 | 15.05 | 0.30 |
| 10 | 15.00 | 0.20 |
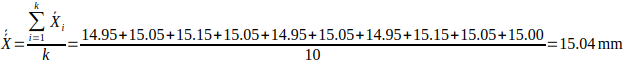
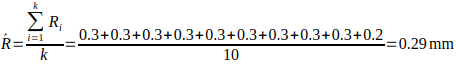
Step 2: Grand mean and average range
Let K = 10 be the number of samples.
Step 3: Control chart constants for
Standard constants (from SPC tables):
- A2 = 0.729
- D3 = 0
- D4 = 2.282
Step 4: Control limits
- X chart


2. R chart

No points (in this subset) violate the control limits, and the ranges are consistent, suggesting the process is in statistical control for this period.
R Chart
Problem 2: Process Capability Indices
Using:
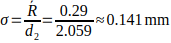
- Estimated process mean μ = 15.04 mm (taken as x̄)
- Estimated standard deviation σ = R̄ / d2, with d2 = 2.059 for n = 4
Determine:
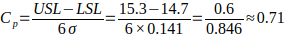
a) Capability indices Cp and Cpk
b) Whether the process is capable relative to the specification limits 14.7–15.3 mm.
Solution 2
Step 1: Estimate process standard deviation
Step 2: Compute Cp
Step 3: ComputeCpk
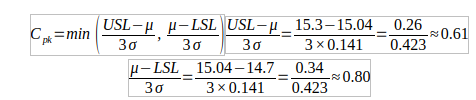
Therefore:
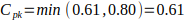
Both Cp≈0.71 and Cpk≈0.61 are less than 1, indicating the process is not capable of consistently meeting the specification limits, despite being in statistical control.
Problem 3: Probability of Defects
Assuming the winding thickness follows a normal distribution with:


Estimate the proportion of stator windings expected to fall outside the specification range 14.7,15.3mm.
Solution 3
Defect probability:

Step 1: Standardize using z-scores
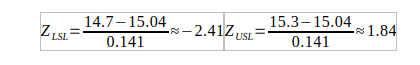
Step 2: Tail probabilities (from standard normal table)

Step 3: Total defect probability

So, approximately 4.1% of motors are expected to fall outside the specification limits.
Problem 4: Effect of Reducing Variability
Engineering sets a target to reduce the process standard deviation by 40% through improved winding machines. Assume the mean remains at μ=15.04 mm and:

Calculate the new Cp, Cpk, and the expected defect probability.
Solution 4
Step 1: New standard deviation

Step 2: New Cp
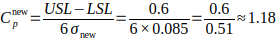
Step 3: New Cpk

Thus:
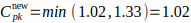
The process becomes capable, with Cpk>1.
Step 4: New defect probability
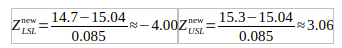
From normal tables:
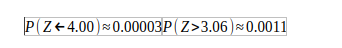
So:

The expected rejection rate improves from about 4.1% to 0.1%, representing a substantial quality and cost improvement.
Managerial Implications
- The SPC analysis shows that the winding process is statistically stable (in-control) but initially not capable of consistently meeting engineering tolerances.
- Investment in improved winding machines, aimed at reducing process variation, increases capability indices to Cp ≈ 1.18 and Cpk ≈ 1.02, and drastically lowers defect probability.
- Ongoing use of X̄- and R̄-charts is essential to maintain long-term stability after improvements.
- The case clearly demonstrates the difference between statistical control and process capability—both are necessary conditions for robust quality assurance in competitive manufacturing environments.
References
- Advantive. “Xbar and Range (Xbar-R) Chart – Guide to Construction and Interpretation.” Accessed 2025.
- Six Sigma Study Guide. “X Bar R Control Charts – When and How to Use Them.” 2025.
- QI Macros. “X Bar R Chart Formula – XbarR Calculations in Excel.” Accessed 2025.
- Minitab Support. “Unbiasing Constants d2(), d3(), and d4().” Includes tables for d2 (2.059 for n = 4) and control chart constants.
- Bessegato, A. “Table of Control Chart Constants A2, D3, D4, B3, B4.” PDF reference for control chart constants.
- Lean QCTools. “Process Capability – Cp and Cpk Calculation with Example.” 2025.
- Six Sigma Study Guide. “Process Capability (Cp & Cpk).” 2025.
- iFactory. “Process Capability Analysis Cp, Cpk, Ppk – A Guide.” Accessed 2025.
- SPC for Excel. “The Estimated Standard Deviation from Control Charts.” 2024.
- SPC for Excel. “Xbar-R Charts: Part 1 – Introduction and Example.” 2024.
- SG Systems Global. “X-bar/R Charts – SPC for Mean & Range.” 2025.
These sources support the use of X̄- and R̄-charts, the constants A2, D3, D4, d2, and the formulas for Cp and Cpk.