


Dr. Shampa Nandi, Faculty, ISME
“Research is to see what everybody else has seen and to think what nobody else has thought”—A.S Gyorgyi
At the initial stage of research, researchers in business or management area often face a dilemma; which is first—theories/research concepts, statistics or software like SPSS, Excel. To be a systematic and good researcher, a person should have basic research concepts, understand statistical techniques and its assumptions and finally make wise use of software. Most of the time all these go hand in hand and error or lack of understanding in one area often blocks the progress in the other part. This article is an attempt to discuss the basics of research emphasising quantitative analysis part of any business research. Topics like sample size, sampling method, data collection procedure and qualitative data analysis are not discussed here.
Research in Business or Management area deals with the intangible latent concepts, attitudes and behavioural aspect, therefore most of these concepts are difficult to quantify. Suppose a researcher wants to measure the Servqual dimensions and its impact on customers (patients) satisfaction and customer loyalty. Except “Tangible” all the other dimensions of Servqual (Reliability, responsiveness, assurance and empathy) are intangible in nature. Therefore, a structured questionnaire has to be prepared by the researcher to obtain the attitude of the customers on these Servqual dimension in a quantifiable manner. Question arises about the reliability and validity of the research instrument or questionnaire. Reliability is nothing but the consistency of the measurement instrument whereas validity measures whether the instrument is measuring what the researcher intends to measure.
It is advised to do a pilot testing to check the reliability of the questionnaire. Most commonly “Cronbach Alpha” test is used to measure the reliability. If “Cronbach Alpha” value is more than 0.7 then it shows questionnaire is reliable. For validity of the research instrument, different types of validity are measured. Mostly in business research content validity, concurrent validity, predictive validity, convergent validity, nomological validity, and discriminant validity are considered. Unfortunately very common direct techniques are not available to measure validity. Subject experts can be consulted for questionnaire preparation to enhance content validity, Cronbach alpha also helps to measure the validity of the questionnaire to a certain extent. Structural equation modelling technique is the most commonly used for measuring the validity of any model. As a beginner it is better to start with a proven set of measurement scale used by an earlier researcher in similar area (available in reputed journals) and then modify according to a current context.
The next part is how to prepare any question in different types of scales- nominal, ordinal, interval or ratio scale. Most of the research method books cover the definitions of all the above mentioned scale. The question often arises in the mind of the researcher—what is the significance of framing a question in each type of scale. Question can be framed in any types of scale depending on the researcher’s objective as well as the techniques going to be used to analyse the data. Let’s take an example—Question about an employee’s salary can be framed in the following ways—
- According to you, how is your salary? Good/ Bad (Nominal scale)
- Please indicate your level of salary. Very High / High / Moderate / Low. (Ordinal Scale)
- Indicate your salary level on a scale of 1-10. (Interval Scale)
- What is your gross salary in Indian rupee per month? (Ratio Scale)
Before elaborating on why so much importance is given on framing any question in different type of scale, let’s have some idea about the various types of data analysis.
Most basic type of statistical analysis is “Descriptive analysis”, which is used to summarise the responses from large number of respondents in a few simple statistical measures. Data can be described in terms of “Frequency”, “Central Tendency’ and “Statistical Distribution” followed by a set of data. Mean, median, mode, range, standard deviation, variance are widely used in descriptive statistics. Data description can be done with the help of tabulation, graphs, charts and cross tabulation. Mean, median and mode gives an idea about the central tendencies of the data and range and standard deviation depict the variability of data. Following table gives an idea about various measures of descriptive analysis to be used for various types of scales.
Nominal Scale | Ordinal Scale | Interval Scale | Ratio Scale |
Mode, Frequencies | Mode, Median, Frequencies, Range | Mode, Median, Frequencies, Range, Mean, Standard Deviation | Mode, Median, Frequencies, Range, Mean, Standard Deviation, Geometric mean, Harmonic mean |
Once the data description is done inferential statistics plays a role to test hypothesis. It means some inferences can be drawn about some population based on the observation of a small sample. For example a research on work life balance of Indian working women does not need the entire Indian working women to be studied, it can be done by taking a sample consisting of small number of females who are working in various sectors in a geographical area. Hypothesis testing is utilized to do the inferences. Hypothesis is a formal statement of explanation stated in a testable form. Hypotheses are tested to draw a conclusion about population or about dependency of variables. Depending on the number of variables to be studied, there types of stat
istical analysis are there—
istical analysis are there—
- Univariate statistical analysis
- Bivariate statistical analysis
- Multivariate statistical analysis
Most commonly in business research, two types of hypotheses are tested.
- Relational Hypothesis– Examine how changes of one variable vary with changes in other. E.g. Advertisement increases sales.
- Hypothesis about differences– examine how some variable varies from one group to another. E.g. Stress level varies among working women of IT and Non-IT sector.
For univariate analysis, one more type of hypothesis is tested- hypothesis about differences from some standard. E.g. More than 50% of males in Bangalore smoke.
- Univariate test for metric data can be done through t test or z-test depends on sample size and whether standard deviation of the population is known or can be estimated from sample.
- Univariate test for non-metric data can be done through chi square, test, K-S or Runs test to drawn
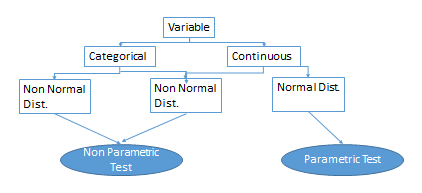
Bi-variate Analysis– Different types of statistical techniques are used to analyse bi variate data, based on- a) scale of measurement b) type of distribution c) purpose of the test(significant relation or significant differences). Nominal and Ordinal scales are forming categorical scale whereas Interval and Ratio scale comprise Continuous scale. Categorical variables follows non-normal distribution (Poisson, Binomial etc.) and continuous variables may follow a normal or non-normal (Poisson, Binomial etc.) distribution. To check whether the variable follows a normal or non-normal distribution, researcher can use K-S test or Shapiro Wilk Test. Box plotof all the observation of the variables also gives an idea about the distribution.
Scale of measurement and type of distribution are the two factors to be considered to decide whether to use parametric or non-parametric test. Please refer the diagram below for Bi-variate data analysis:
 |
| Figure-1 |
A general guidelines for applying different statistical techniques is given below:
< /div>
Case | X Variable | Y Variable | Distribu-tion of Y variable | Purpose | Type of test | Statistical Technique |
1 | Cat | Cat | Non Normal | Sig. Difference | Non Parametric test | Chi square or Z test |
2 | Cont. | Cont. | Normal/ Non-Normal | Sig. Relation | Parametric test/ Non-Parametric test | Pearson’s Correlation, bi-variate regression/Spearman’s Rank Correlation |
3 | Cat (X variable has 2 categories) | Cont. | Normal/ Non-Normal | Sig. Difference | Parametric test/ Non-Parametric test | T test (paired t test or independent t test)/ Mann Whitney test |
4 | Cat (X variable has 3 or more categories) | Cont. | Normal/ Non-Normal | Sig. Difference | Parametric test/ Non-Parametric test | ANOVA test/ Kruskal Wallis test |
For further clarification, let’s consider one example of each type of case:
Case 1: H0 (Null Hypothesis): There is no significant association between performance and training (when both performance and training are measured in nominal or ordinal scale) – Chi square test
Case 2: H0 (Null Hypothesis): There is no significant association between income of the parents and IQ level of the students (when both income and IQ are measured in Interval or ratio scale) – Pearson’s correlation test
Case 3: Independent samples
H0 (Null Hypothesis): There is no significant difference of financial awareness among male and female. – t test (if sample size <30) OR Z test ((if sample size >= 30)
Dependent samples: H0 (Null Hypothesis): There is no significant difference of sales of the product before and after sales promotion. – Pearson’s correlation test
Case 4: H0 (Null Hypothesis): There is no significant difference in the mileage of the three types of cars. – One way ANOVA
For all the above test if the value of p < 0.05, null hypothesis should be rejected at 5% level of significance.
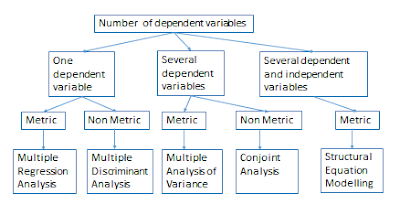
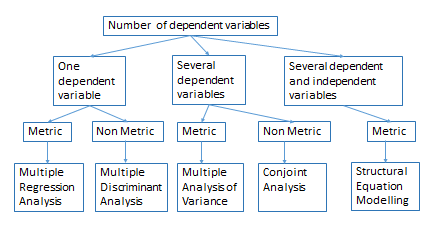
Multivariate Data Analysis- Research involving three or more variables or that is concerned with underlying dimensions among multiple variables, will require multivariate statistical techniques to analyse data. Suppose the case discussed at the beginning of the article, impact of Servqual dimensions on Patients’ loyalty in case of Hospital. Multivariate data analysis are classified into two basic groups –Dependence method and Interdependence method.
Dependence Methods– When hypothesis contains dependent and independent variables “Dependence Techniques” are used. Again the technique varies depending on metric or non- metric data and on number of dependent variables. They are—
Interdependence Techniques: Any research examines questions that do not distinguish between independent and dependent variables will be analysed by interdependency techniques.
- For metric inputs — Factor Analysis, Cluster Analysis and Metric-Multidimensional Scaling techniques are used.
- For non-metric inputs- Non Metric multidimensional scaling technique is used
All the above data analysis techniques have various assumptions and applicability. Each of the statistical technique again needs to be discussed elaborately. This article is only an attempt to give an overview of most commonly used techniques in business research. A research has to decide about when to use which techniques, depending on the objective of the research, types of data and distribution of the data and the assumptions underlying in each technique.