







Abstract:The growth of a developing economy is driven by the capital market investments which are financed through domestic savings by households and institutions. India being one of the growing economies is the land of investment opportunities like equity, bank deposits, bonds, mutual funds, post office deposits, real estate, derivatives, gold, insurance and many more. According to the economic survey, India’s gross capital formation has reached 11.8% in the year 2022 from 10.7% but even then there is a need for stimulation of investment incentivizing policies to recover the economic slowdown in respect of savings and investments ratio in India. An attempt is made to understand the investment pattern of government of Karnataka employees as they receive regular income that can be well utilized by routing it to an effective investment channel. The study examined the influence of demographic factors on their investment preference and their overall investment pattern. It is found out that age and experience impacts their investment pattern and large amount of their funds are routed to less risk securities like bank deposits, insurance and post office schemes and investors have shown least preference towards equity and debt instruments.
Keywords: Investment, savings, economy, Government employees, Demographic factors.
JEL Classification: G11
Introduction
Savings are the portion of income kept aside by the individuals for future use. Those Savings when sacrificed in expectation of future benefit becomes an investment.
Investment is the act of allocating funds on an asset or committing capital amount to an Endeavor with the expectation of generating income/gain in future. The savings and investments are the two macro-economic variables which supports capital mobilization promoting employment opportunities, price stability and thereby contributing for economic growth of the nation. Generally, investors employ their savings into investments with the objectives like capital appreciation, return maximization, liquidity, availing tax benefits, risk minimization, safety etc.
Understanding these objectives leads to adequate accumulation of funds from different class of investors and channelizing into the Indian capital market. The economic advancement of a country is strongly based on its capital accumulation which in turn is based on the savings andinvestments (Asia’s Journey to prosperity Book, 2020). To achieve higher level of financial growth, Indian economy has to strengthen its capital market by attracting sufficient capital in the formof investments from different class of investors. Investor friendly financial instruments can make investors to sacrifice their current income in expectation of future returns.
Money earned from investing is greater than money saved. Fear of losing is higher than probability of gaining is observed in majority of the investors. (Prospect theory 2010). Financial literacy is one of the influencing factors that build financial resilience in the investors. A consistent financial education and policy builds financial literacy which helps the individuals to be financially resilient at times of crisis (Erdem & Rojahn 2022). Both government and private employees are found to be risk averse and takes less than 10% risk ininvestments (Jaya Prakash, et.al 2017). In this context understanding the investment purposes and pattern of different investor classes will strongly support the financial institutions in framing the financial plans and products accordingly.
Statement of the Problem
Investor’s decisions are driven by economic, behavioral, psychological and many other factors. Previous studies say that, Indian financial market has numerous investment opportunities, but still majority of the investors are inclined towards the traditional investment alternatives like bank deposits, insurance and other safe avenues. As government employees earn regular and steady income, their savings can be efficiently routed to right and profitable investment options, but not much survey has been conducted for this investor class. So this study identifies the investment pattern of government of Karnataka employees and the demographic factors affecting their investment decision.
Review of literature
Sangeetha D (2013) gave a clear picture about the importance of savings and investmenton the Indian economy based on statistical survey released by financial bodies. For a developing country like India, increased accumulation of domestic savings in the form of investments leads to increased GDP and supports the growth of an economy. The author suggested the investors to invest in risky assets in order to earn higher returns as well as to reap the benefits of derivatives products which are used to hedge the risk. Inflation also acts as an indicator to understand the return that has to be generated to match with inflation rate. Long period of investment holding generates higher return and avoids risk of volatility. According to the statistics, only 5% of individual income is been converted into investment which is not a good sign and majority of the funds are going to bank deposits, insurance and PPF channels. Investors should increase their savings percentage and invest in diversified portfolio (combination of risky and risk less securities) to earn better returns.
Vinod (2013) pointed out that even after being in the bracket of regular income fromcentral government, railway employees at Gwalior chooses the insurance as the safest investment avenue that too specifically public sector insurance company like LICfollowed by bank deposits. Majority of the respondents are risk averse and have least awareness about the capital market products like equity, mutual funds, derivatives etc. Employees avoids brokers/ investment consultants for their decision and they are back of tax saving and return oriented instruments. As railways are the largest revenue generator of India, it is prudent for the financial intermediaries to attract savings from the salaried employees and Route it to modern financial instruments which sequentiallyresults in country’s capital formation and income generation for the investors.
Shinde & Zanvar (2015) tested whether demographic traits have a determinant effect on the investment selection of the investors. Age, education and income influences the investment decisions to a greater extent when compared to other factors like gender, occupation and marital status. Similar to other studies, here also it is proven that majority of the respondents irrespective of age prefers less risk investment alternatives like NSC, PPF, Bank deposits and insurance. Only few investors in high income group have shown interest in the portfolio of risky and risk less alternatives. When it is evident that demographic traits have a determinant effect on the investment decisions, it is easy for the financial bodies to track the investment behavior and move the financial products to them.
Das & Kumar (2016) analyzed savings and investment behavior of Indian middle-class households with special concentration towards discretionary savings. Savings pattern of investors are not influenced by investor’s employment as well as monthly income but the investment behavior is significantly affected by the investor’smonthly income. If majority of the Indian households sufficiently converts theirdiscretionary savings into investment, then it increases the standard of living as well asimproves economic development of the country. Financial institutions, fund houses, policy makers have to respond to middle class investors by understanding their investment goals and frame the strategies accordingly.
Jayaprakash et.al (2017) highlighted the investment pattern of government and private employees in Kerala with special reference to Ernakulum city. The selected respondents have shown common investment pattern like choosing safe and tax saving investment avenues like insurance, post officedeposits and provident funds. Both government and private employees are found to berisk averse and takes less than 10% risk in investments. Most of the investment practicesare found to be similar between government and private sector employees and they agree that the return on investment grow at a faster rate than inflation. Economic factorslike inflation rate, GDP, unemployment rate and government policies influences the investor’s investment decision. Even though financial literacy is found among few investors, inadequate stock market knowledge is keeping the Investors out of stock market investments.
Sah (2017) India is witnessing the increase in the percentage of working women which results in increased savings and investment activities in the economy. The study underlines that majority of the women surveyed in Hyderabad are responsible for their family expenditures for which they expect short term gains from the investmentand depend mainly on their family / friends circle for investment information. It is a good sign that women are more interested to learn about various innovative financial products to earn maximum returns with minimum risk. As still many female investors are involved in conventional form of investment it is the responsibility of financial institutions and policy makers to create awareness among them which leads to wealth creation for both individuals and the society as a whole.
Mubarak and Ramesh (2020) exhibited that majority of the investors belonging to the professional class, channel their funds into the equity and derivatives (futures and options) instruments for capital appreciation as well as to hedge the risk. Avenues likedebentures, real estate, and exchange traded funds are least preferred. Mutual fund attracts the tax savers whereas gold and pension funds attract long term investors and insurance will be usually selected by the risk averse investors. Modern day investors are knowledgeable and cautious about various high risky and profitable capital market instruments.
Gaikar & Lakhani (2020) explained the relationship betweenfinancial investments with demographic variables of individuals residing in the major areas of Mumbai. It is quite evidential that most of the Mumbai investors under the study have opted for investments which have high growth opportunities and insuranceoriented products to hedge against future uncertainties. Except gender and nature of employment other variables like age, income, educational qualification, work experience has an impact on the selection of investment schemes especially on growth and insurance oriented products. Urban investors with high income are high risk takersand prefer stock market securities and low income individuals cannot face the negativereturns from the risky securities.
Sondhi (2020) in her paper studying preferences of the government employees towards savings and investment proved that selected respondents from the Mandi district of Himachal Pradesh opt for risk free and safe avenues to invest their savings and major funds channelizes to private sector. Well qualified employees with high income and having access to various information sources depend more on friends and Relatives for financial guidance. It is identified that stock market investors tend to wait for improvement to cover up the losses. The study suggests investors to conduct investment analysis to build a good portfolio and recommends institutions to attract the untapped savings with investor friendly instruments.
Tyagi et.al (2021) pointed out that youth are nowadays inclined towards mutual fund investments and many are investing in IPO without sufficient knowledge about the capital market. But still it is evident that most of the young investors are routing their funds to bank deposits due to risk factors in other investmentchoices. Young investors are growth oriented and wish to invest in growth funds to earnhigher returns. For developing country like India, attracting the funds from the youth creates a healthy financial environment and fosters economic growth.
Veena & Chitra (2022) attempted to find out how societal factors, personal factors and government policy influences the investment pattern of Indian women investors. Women Investors in India have employed in their funds in both traditional as well as modern instruments but still many of the female investors are getting influenced by family member’s opinion and societal differentiation in respect of their investment decisions. It is fortunate that RBI and other financial institutions have initiated an exclusive strategies and programs to attract more number of women investors into capital market instruments. As women are becoming financially literate, they are ready to take higher risk to earn maximum returns so it is the financial institutions that have to come out of the stereotype opinion about them and should encourage investments into contemporary instruments from women investors.
Tejinder Singh (2018) in his survey found that age, gender and income influence the investment decision and many potential investors are not much aware about mutual fund investment. They prefer other investment alternatives compared to MF due to riskfactor, lack of awareness, misguiding brokers etc. 61% of MF investors are satisfied with their choice not because of services of brokers, it is mainly due to the returns generated by MF. Creating a right platform for investors may result in the growth of capital markets.
Objectives of the study
- To study the investment pattern of government of Karnataka employees.
- To understand the influence of demographic factors on the investment preference ofgovernment of Karnataka employees.
- To analyse the factors influencing the investment decision of government of Karnatakaemployees.
Research Design
Type of research
Descriptive type of research is being adopted for the study to understand the investment choiceof employees working in government departments of Karnataka and influence of demographicfactors on their investment decision.
Sources of data collection
The study is based on primary data which is collected through a structured questionnaire fromthe investors working in different government departments.
Sampling plan
Types of sampling – Judgmental sampling technique are used in the study wherein the Data is collected from those respondents who are involved in investment activity.
Sample Size – The sample size for the study is 100. Employees working in different government departments of Multi Storied building, Bangalore have considered for the study. Questionnaires were distributed to those respondents who were involved in investment activity.
Hypotheses
Main Hypotheses
H0: There is no significant relationship exists between investment preference and the demographic factors of investors.
H1: There is a significant relationship between investment preference and the demographicfactors of investors.
limitations of the study
- Government employees working in Bangalore city were only considered for the study.
- Behavioral aspects are not considered in the study.
Analysis and Interpretation
Data analysis
Demographic profile of the investors
Three main demographic factors – Age, Gender and number of years of experience were studied and their influence on the investment pattern examinedusing T test and Anova.
Investment preference
Investor’s preferences among six different investment alternatives were analyzedusing percentage analysis. Investment alternatives analyzed in the study:
- Equity shares
- Mutual funds
- Insurance
- Debt instruments
- NSC, PPF & Bonds
- Bank deposits
Investment profile
Concept of risk, return, percentage of saving and investment were analysed using cross tabulation and percentage analysis. Descriptive statistic tools were adopted for find the most influencing factors for investment decision making.
Statistical tools adopted for the study
- Cross tabulation
- Percentage analysis
- Anova
- Descriptive statistics
Demographic Profile of the investors
Percentage analysis adopted to identify the major demographic factors.
Table 1.1 Demographic details of the investors
| FACTORS | OUTCOME |
|---|---|
| Gender | Majority are female |
| Age | Majority are in group of 41- 50 years. |
| Educational qualification | Most of them are post graduates |
| Experience and Grade | Most of the investors hold 11-15 years and come underGrade B |
| Marital status | Married |
| Other source of income | No |
| Monthly income | Above 60000. |
| Savings | 11%-15% |
Source: Primary data
Demographic factors influence on the investment pattern
Gender and investment preference of investors.
Sub Hypotheses 1
H0: There is no significant relationship between investment preference and the gender of the investors
H1: There is a significant relationship between investment preference and the gender of the investors.
Table 1.2 Anova test for investment preference and gender of the investors
| Sum of Squares | df | Mean Square | F | Sig. | ||
|---|---|---|---|---|---|---|
| Equity amount | Between Groups | .031 | 1 | .031 | 1.597 | .209 |
| Within Groups | 1.929 | 98 | .020 | |||
| Total | 1.960 | 99 | ||||
| Mutual fund amount | Between Groups | 1.442 | 1 | 1.442 | .841 | .361 |
| Within Groups | 167.998 | 98 | 1.714 | |||
| Total | 169.440 | 99 | ||||
| Insurance amount | Between Groups | .000 | 1 | .000 | .000 | .989 |
| Within Groups | 139.760 | 98 | 1.426 | |||
| Total | 139.760 | 99 | ||||
| Debt instrument amount | Between Groups | .019 | 1 | .019 | .169 | .682 |
| Within Groups | 10.891 | 98 | .111 | |||
| Total | 10.910 | 99 | ||||
| NSC ,PPF, Govt Bonds amount | Between Groups | .150 | 1 | .150 | .048 | .826 |
| Within Groups | 302.610 | 98 | 3.088 | |||
| Total | 302.760 | 99 | ||||
| Bank FD amount | Between Groups | .094 | 1 | .094 | .032 | .858 |
| Within Groups | 285.266 | 98 | 2.911 | |||
| Total | 285.360 | 99 |
Source: Primary data
The above test table shows that the significance level for all the six alternatives are more than the p value 0.05 which results in accepting the null hypotheses that there is no significant relationship between the gender and the investment preference. Both male and female investors have shown similar investment pattern.
Age and investment preference
Sub Hypotheses 2
H0: There is no significant relationship between investment preference and the age of the investors
H1: There is a significant relationship between investment preference and the ageof the investors.
Table 1.3 ANOVA test for investment preference and the age of the investors
| Sum of Squares | df | Mean Square | F | Sig. | ||
|---|---|---|---|---|---|---|
| Equity shares | Between Groups | 0.495 | 3 | 0.165 | 6.552 | 0.000 |
| Within Groups | 2.415 | 96 | 0.025 | |||
| Total | 2.910 | 99 | ||||
| Mutual fund and SIP | Between Groups | 7.651 | 3 | 2.550 | 23.122 | 0.000 |
| Within Groups | 10.589 | 96 | 0.110 | |||
| Total | 18.240 | 99 | ||||
| Insurance products | Between Groups | 2.914 | 3 | 0.971 | 11.107 | 0.000 |
| Within Groups | 8.396 | 96 | 0.087 | |||
| Total | 11.310 | 99 | ||||
| Debt instruments | Between Groups | 0.149 | 3 | 0.050 | 1.731 | 0.166 |
| Within Groups | 2.761 | 96 | 0.029 | |||
| Total | 2.910 | 99 | ||||
| NSC,PPF,Govt Bonds | Between Groups | 3.040 | 3 | 1.013 | 8.789 | 0.000 |
| Within Groups | 11.070 | 96 | 0.115 | |||
| Total | 14.110 | 99 | ||||
| Bank Fixed deposits | Between Groups | 4.005 | 3 | 1.335 | 11.917 | 0.000 |
| Within Groups | 10.755 | 96 | 0.112 | |||
| Total | 14.760 | 99 |
Source: Primary data
As per the above Anova analysis, it can be interpreted that except for debt instruments, all other investment avenues significance value is less than 0.05 which indicates that alternate hypotheses is accepted for 5 avenues except for debt instruments. There exists a significant relationship between age of the investors and their investment preference.
Number of years of experience and investment preference.
Sub Hypotheses 3
H0: There is no significant relationship between investment preference and the number of years of experience of the investors
H1: There is a significant relationship between investment preference and thenumber of years of experience of the investors.
Table1.4 ANOVA test for investment preference and number of years of experience
| Sum of Squares | df | Mean Square | F | Sig. | ||
|---|---|---|---|---|---|---|
| Equity shares | Between Groups | 0.493 | 3 | 0.164 | 6.532 | 0.000 |
| Within Groups | 2.417 | 96 | 0.025 | |||
| Total | 2.910 | 99 | ||||
| Mutual fund andSIP | Between Groups | 7.107 | 3 | 2.369 | 20.427 | 0.000 |
| Within Groups | 11.133 | 96 | 0.116 | |||
| Total | 18.240 | 99 | ||||
| Insurance products | Between Groups | 1.099 | 3 | 0.366 | 3.444 | 0.020 |
| Within Groups | 10.211 | 96 | 0.106 | |||
| Total | 11.310 | 99 | ||||
| Debt instruments | Between Groups | 0.993 | 3 | 0.331 | 16.584 | 0.000 |
| Within Groups | 1.917 | 96 | 0.020 | |||
| Total | 2.910 | 99 | ||||
| NSC, PPF, Govt Bonds | Between Groups | 3.232 | 3 | 1.077 | 9.509 | 0.000 |
| Within Groups | 10.878 | 96 | 0.113 | |||
| Total | 14.110 | 99 | ||||
| Bank Fixed deposits | Between Groups | 4.954 | 3 | 1.651 | 16.165 | 0.000 |
| Within Groups | 9.806 | 96 | 0.102 | |||
| Total | 14.760 | 99 |
Source: Primary data
The above analysis projects that the significance value of all the investment alternatives are less than p value 0.05 which rejects the null hypotheses and thereby indicates that there exists a significant relationship between number of years of experience and the investment preference ofthe investors.
Outcome of the Main hypotheses
Gender, Age and experience have been tested under the heading of demographic factors usingAnova. Except gender, age and number of years of experience have a significant relationship with the investment preference of the investors.
Therefore, it can be interpreted that there exists a significant relationship between demographicfactors and the investment pattern of government of Karnataka employees.
Investment profile
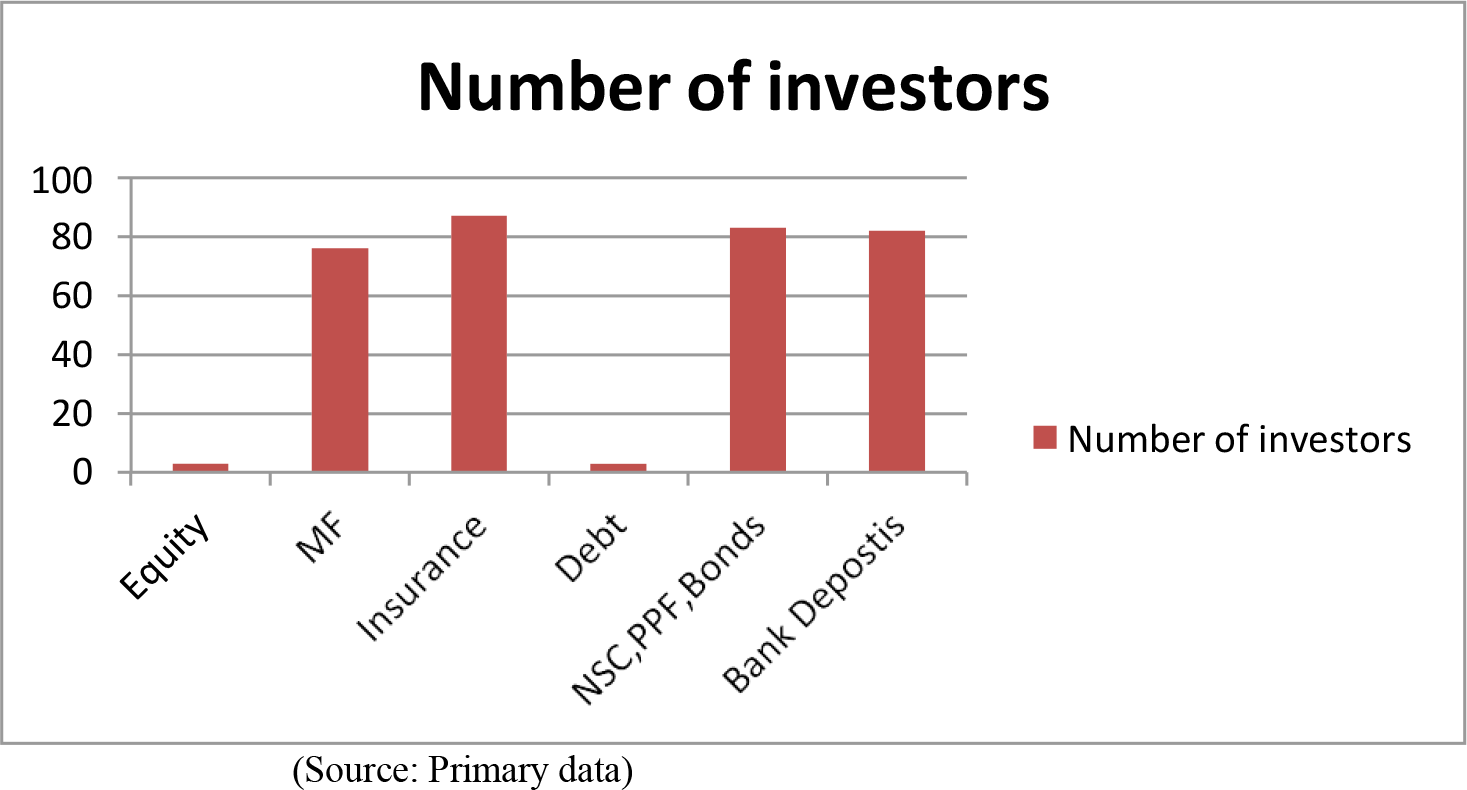
Graph 1.1 Investment preferences of the investors.
Source: Primary data
The above graphical representation shows that majority of the investors prefer to channelize their funds in insurance followed by bank deposits and NSC, PPF & Bonds. Around 70 investors prefer to invest in mutual funds whereas debt and equity are the least preferred avenues.
Factors influencing the decision making of the investors
Descriptive statistics has been adopted to identify the most influencing factors for investment decision making.
Table 1.5 Descriptive statistics for factors influencing investment decisionmaking
| N | Minimum | Maximum | Mean | Std. Deviation | |
|---|---|---|---|---|---|
| Returns are considered as a Parameter while investing. | 100 | 3.00 | 5.00 | 4.0200 | 0.40151 |
| Consideration of entry and exit load during investing | 100 | 3.00 | 5.00 | 3.2100 | 0.51825 |
| Risk factor is considered while investing | 100 | 3.00 | 5.00 | 4.6400 | 0.68931 |
| Tax benefit is considered while investing | 100 | 3.00 | 5.00 | 4.0100 | 0.38912 |
| Capital appreciation is considered while investing. | 100 | 2.00 | 5.00 | 3.2500 | 0.59246 |
| Consideration of financial advice for investing. | 100 | 2.00 | 5.00 | 3.9100 | 0.49431 |
| More preference for investment Schemes having good credit rating. | 100 | 2.00 | 5.00 | 3.2200 | 0.54272 |
| Consideration of liquidity Factor (Withdrawal Facility) while investing. | 100 | 2.00 | 5.00 | 3.2600 | 0.66088 |
| I consider the brand or company name before investing. | 100 | 1.00 | 5.00 | 3.8700 | 0.59722 |
| Past experience affects you in investing. | 100 | 2.00 | 5.00 | 3.2700 | 0.63333 |
| Valid N (list wise) | 100 |
Source: Primary data
The descriptive statistics table projects that risk, return and tax benefits are the major influencing factors among all as the mean value of these 3 are highest i.e 4.64, 4.02 and 4.01 Respectively. Consideration of financial advice and the brand company stands next inthe set of influencing factors.
Percentage of savings and percentage of investments from savings
The relationship between the percentage of savings and the percentage ofinvestment that come from savings is been examined using cross tabulation tool.
Table 1.6 Cross tabulation
| Percentage of savings | Percentage of investment from savings | Total | |||
|---|---|---|---|---|---|
| Less than 15% | 15% – 30% | 30%-45% | More than 50% | ||
| Between 1%-10% | 6 | 2 | 2 | 0 | 10 |
| Between 11%-15% | 3 | 69 | 1 | 0 | 73 |
| Greater than 15% | 5 | 9 | 1 | 2 | 17 |
| Total | 14 | 80 | 4 | 2 | 100 |
Source: Primary Data
The above crosstab gives clear picture on percentage of investments that are routed from the percentage of savings of the investors. It indicates that majority of the investment comes from the investors who save between 11%-15%. (69 investors) and only 9 investors who save morethan 15% invests about 15%-30%.
Risk, Return and Purpose
Risk – The percentage analysis shows that the majority of the investorsworking in government departments are medium risk takers.
Return – Majority of the investors expects 10% – 20% return from their investments.
Purpose behind investment – Majority of the investor’s invest for the purpose having funds for their children education, asset purchase, higher return and to avail tax benefits.
Findings
- Both male and female respondents prefer to employ their funds in safe avenues like bank deposits, insurance and NSC, PPF and Govt Bonds. No much difference found between the genders.
- Equity and Debt instruments are least preferred among all the employees considered inthe study.
- Very few among the experienced and highly qualified investors have chosen mutual fund investments and most of investors have shown interest in understanding the investments in mutual fund schemes.
- Respondents under study save around 15-30% of their income per month and invest around 10% – 20% of their savings.
- It is proved that except gender, there exists a significant relationship between demographic factors like age and number of years of experience and the investment preference of the investors.
- Majority of the investor’s decision is based on the return percentage, risk factor and taxbenefits.
- Most of the government employees are medium risk takers and expect 10%- 20% Return fromtheir investments.
Suggestions
Investors who earn regular income have to conduct detailed analysis into various investment alternatives before investing their funds. As the capital market instruments are gaining popularity in generating good returns with wise investment strategy investors can channelize their funds into mutual funds or direct equity instruments.
Financial institutions should design innovative financial products after proper understanding of the demographic and psychologicalfactors influencing the investment decision of the investors. Financial institutions are advised to organize investment awareness programs for different class of investors.
Conclusion
The study figured out the effect of demographic factors on the investment pattern of selected employees working in government of Karnataka departments. Age and experience influences the investor behavior in a greater manner except gender. As only 10% – 20% of savings are getting channelized into investments there exists an opportunity for financial institutions to channelize those funds into a profitable investment. Understanding the investor’s demographic factors, risk and return profile and factors that influence their investment decisionis a crucial aspect while designing the financial products hence the financial institutions has to come up with various investor friendly investment tools, websites, awareness camps, financial services to attract funds from varied class of investor groups.
References
Ahmad Yousef Areiqat & 3 others (2019). Impact of behavioural finance on stock investment decisions – Applied study on sample of Investors at AMMAN stock exchange. AcademyOf Accounting and Financial Studies Journal, 23, Issue 2.
Amborse jagong & Vincent S Mutswenje (Feb 2014). A study of the factors influencing investment decisions: The case of individual investors at NSE (Nairobi Stock Exchange). International Journal of Humanities and Social Sciences, 4, no.4 Special Issue.
Devika Jayaprakash, Linzy Ajayan and Jayashankar.J (2017). Investment Pattern: A comparative study on the government and private employees with special reference to kerala. International Journal of economic research. 14, ISSN: 0972-9380, Number 15(Part 4).
Dr. Aparna Samudra, Dr. M.A. Burghate (May 2012). A study on investment behavior of middle class households in Nagpur. International Journal of Social Sciences and Interdisciplinary Research, 1. No. ISSN 2277 3630.
Dr. C. M. Shinde, Priyanka Zanvar (November 2015). A study of investment pattern on the basis of demographic traits, International Journal of Research – GRANTHAALAYAH, 175-205.
Dr. Jyoti Sondhi (2020). A Study on the Saving and Investment Preference of Government Employees on Various Investment Avenues in District Mandi (Hp) IOSR Journal of Economics and Finance (IOSR-JEF), e-ISSN: 2321-5933, p-ISSN: 2321-5925. 11, Issue 1 Ser, 43-46.
Dr. Vilas gaikar, sameer aziz lakhani (2020). Demographic variables influencing financial Investment of urban individuals: a case study of selected districts of Maharashtra state. International Journal of Advanced Science and Technology, 29, No. 05, (2020), 962-974.
Dr. C. M. Shinde, Priyanka Zanvar (2015) Shalini, Nanddhaneja and Ashok. (2011). Predictorsof preferences for financial investment products using cart analysis. Journal of Indian Business Research.
Dr. Vinod K Bhatnagar (January 2013) Investment behavior of investors – A study of railwayemployees at Gwalior. Research Gate.
Gaurav kabra, Prashanth kumar Mishra, Manoj kumar dash. (2010). Factors influencinginvestment decision of generation in India: An econometric study. Asian Journal of Management Research, ISSN 2229 – 3795.
John Ameriks, Tanja wranik, Peter salovey (January 2009) Emotional intelligence and Investor behavior. Research foundation – CFA Institute, ISBN 9781934667224.
Lubna Ansari and Sana moid (June 2013) Factors affecting investment behavior among youngprofessionals. International Journal of Technical Research and Applications, 1 Issue 2 May.
Manisha Tyagi, Krishna Chanchal, Dr Raj Kumar S (August 2021). Investment pattern of youth in India. International Journal of Scientific Research in Engineering and Management (IJSREM), 05 Issue: 08, ISSN: 2582-3930.
Mubarak and Dr. Ramesh Olekar (April 2020). Behavioral study of investors towards investment avenues of Indian capital market in select cities of Karnataka state. Mukt Shabd Journal, IX, issue 4, ISSN NO.2347 – 3150
P. Vanishree Sah (December 2017). A Study on investment behavioral patterns of women investors, CVR Journal of Science and Technology, 13, ISSN 2277 – 3916.
Puneeth Bhushan and Yajulu Medury. (2013). Gender Differences in Investment Behaviour among Employees, Asian Journal of Research in Business Economics and Management,3, No. 12. ISSN 2249-7307, 147-157.
Puneeth bhushan. (2014). Insights into awareness level and investment behavior of salaried individuals towards financial products. International Journal of Engineering, Business and Enterprise, Applications ISSN (Online): 2279-0039 (Print): 2279-0020.
Sangeetha D (2013). Investment and its Role in Economic Development. International JournalOf Science and Research (IJSR) ISSN (Online): 2319-7064 Index Copernicus Value (2013): 6.14 | Impact Factor (2013): 4.438.
S. Kaleeswari & Dr. A. Vani. (2022). Government and private employee’s satisfaction on post office saving schemes. International Journal of Scientific Research and Modern Education, 6, Issue 2, 2021, Impact Factor: 7.137, ISSN (Online): 2455 – 5630.
S. Veena, Dr. R. Chitra Siva Subramanian (Feb 2022). Role of Government Policy, Societal Influence, Family & Personal Characteristics on Investment Style and Investment Patternof Women Investors in India. International Journal of Mechanical Engineering, 7, ISSN: 0974-5823.
Sobhesh kumar agarwalla, Samir barua, Joshy Jacob, Jayanth Varma (June 2012). A survey offinancial literacy among students, young employees, and the Retired in India. IIM Ahmedabad – sponsored by CITI foundation.
Tejinder singh. (2018). A study of factors affecting investor decisions for various investment channels with special reference to MF investments – a case study of ICICI Securities ludhiana, punjab, India. Pramana research journal, 8 issue 9.
S C Das, Vivek Kumar (December 2016). Discretionary Savings and Investment Behaviour of Middle Class Households in India: Empirical Evidence Study.
Acknowledgment
This article was presented at 11th International Conference on Contemporary Issues in Management organized by International School of Management Excellence, Bangalore held on 24th and 25th February 2023.