







Abstract:Marketers now view influencer marketing as an essential component of their available marketing options due to its rapid expansion worldwide. The literature on this topic provides numerous definitions of influencer marketing. It is frequently cited as one of the most important new marketing strategies of the past decade. The web offers a commercial center and a channel for arriving at likely clients. One of the best ways to accomplish this is by involving influencers in the marketing campaign. This study aims to determine what influences consumers’ perceptions of influencer marketing and find out howdemographic variables moderate between independent variables and consumer perception on influencer marketing. The influencing factors considered for this study are trustworthiness, knowledge, homophily, attitude and likability. Quantitative method is used, whereby a self-administered questionnaires were distributed to obtain data using convenience sampling. Statistical Package for the Social Sciences (SPSS) were used to analyze data collected. Linear regression analysis was used to assess the impact of the influencing factors on purchase intention. The findings indicate that a significant amount of relationship between all the independent variables toward purchase intention and hierarchical linear regression was used toprove that demographic variable such as household income, gender and employment moderatespurchase intention in influencer marketing.
Keywords: Influencer marketing, social media influencers (SMI), trustworthiness, knowledge, homophily, attitude, likability
Introduction
Businesses frequently use paid advertising to speed up the process of increasing sales, engagement, and awareness. Lately, powerhouse showcasing has additionally demonstrated to be essentially successful as conventional promoting.
Social media has been increasingly popular and used for advertising in the modern world. Additionally, social media influencer marketing is not a recent development in the system; rather, it is the primary factor behind the decline in online marketing consumers (Kalu, 2019). Influencer marketing makes use of well-known and specialized content creators to spread messages to a company’s target market and increase traffic. Worldwide, there are 4.388 billion internet users, and 3.484 billion people use social media. These figures demonstrate how deeply social media has permeated human culture (Hoot suite, 2019).
The way we connect has changed as a result of social networks, where users are more active content creators. The ascent of verbal exchange advertising patterns has prompted an expansion in the prevalence of force to be reckoned with promoting. Businesses are recognizing the influencers’ ability to influence a buyer’s decision as a result of an increasing number of customers using social media platforms. As indicated by the Force to be reckoned with Showcasing Report, the Indian powerhouse industry is projected to extend at a build yearly development pace of 25% in the next 3 years, when it would be worth Rs 2,200 cr (Verma, 2022).
Influencers include notable design photographic artists for Instagram, master network safety authors on Twitter, and reliable promoting leaders on LinkedIn Famous Indian influences include Bhuvan Bam, Kusha Kapila, Diipa Büller-Khosla, and Nikhil Sharma (AGENCY, 2022).
Literature Review
Influencer
An influencer is a person who, because of their status, standing, reputation, knowledge, or relationships with their audience, possesses the ability to influence purchasing decisions of their followers. Influencers are valuable social connection resources that businesses can utilize to achieve their marketing goals in addition to being useful marketing tools.
Social media influencers serve as role models for decision-making. Social media influencers are people who frequently post about a topic on their preferred social media platforms and have earned a reputation over time as being knowledgeable and skilled in that area. By doing this, influencers construct sizable fan bases of dedicated and dynamic adherents. A micro influencer is a standard person who has acquired reputation for knowing a ton about a specific particular field. Micro influencer commonly have a sizable online entertainment following among fans in that particular field (Geyser, 2022).
Influencer Marketing
The process where a third party influences a customer’s purchase decision is known as influencer marketing (Brown, 2008). The process through which a business advertises one of its goods or services by working with an online influencer is known as influencer marketing. Some marketing alliances between companies and influencers rely more on brand recognition than anything else. To connect with a target audience and spread a brand’s message, influencer marketing uses social media influencers with a large following (Insights, 2017).
The literature on this topic provides numerous definitions of influencer marketing. It is frequently cited as one of the most important new marketing strategies of the past decade. The majority of individuals define “influence” as the force of impact on an individual, object, or event. (Brown, 2008). It was shown that 90 percent of buyers believe links from their personal networks, and 81 percent believe internet recommendations (Biaudet, 2017).
The fact that 93% of marketers included influencer marketing in their overall marketing strategy demonstrates how widespread it is currently. This suggests that only 7% of businesses have not yet utilized this strategy to promote themselves to potential new customers. (Shepherd, 2022).
The primary objective of influencer marketing initiatives is to raise brand recognition. Here is a list of the most well-liked goals to give you an idea of what it might aid you in achieving:
- Increasing brand recognition (86%)
- Achieving targeted or new audiences (74%)
- Increasing brand loyalty (69%)
- A rise in sales conversions (46%) (Shepherd, 2022).
Hypotheses Development
Trustworthiness
Trustworthiness is characterized by the endorser’s credibility, genuineness, and respectability. In addition, the perception of the source’s objectivity in terms of reliability by the recipients (Van der Waldt, 2009). Trustworthiness is one aspect of source credibility, and only influencers perceived to be trustworthy in order to influence their followers (Kim, 2008). There is strong evidence thattrustworthiness has an impact on how people behave.
Brown, (2008) asserted that 54% of consumers would refer their friends and family to the items they had purchased if the business had gained their confidence. Rebelo, (2017), asserts that the trustworthiness influencer was more compelling. Followers view the connection as rewarding when they have trust in the influencer, which increases the efficacy of the message (Zeithaml, 1981) (Crosby, 1990).
Miller, (1969) examined the impact of source credibility on how persuasive messages were in an anxiety-inducing setting. An opinionated message of an influencer perceived to be highly trustworthy has higher impact than an non opinionated message. However, when trustworthiness was low, this relationship was insignificant. The informative content of influencer-generated posts and various aspects of influencer credibility can positively affect followers’ trust in influencer-generated branded posts, which in turn improves brand awareness and purchase intentions. Trustworthiness, attractiveness, and perceived resemblance (to followers) of influencers all have a good impact on followers’ belief in their branded postings (Lou, 2019). According to data performed in 2015 by the Tomoson Company using 125 leading companies, merchants make $6.50 for every $1 invested on influencer marketing (Tomoson, 2015).
H1: Trustworthiness positively affects Purchase intention in context of influencer marketing
H1a: Gender moderates the relationship between trustworthiness and Purchase intention in context of Influencer marketing
H1b: Household Income moderates the relationship between trustworthiness and Purchase intention in context of Influencer marketing
H1c: Employment moderates the relationship between trustworthiness and Purchase intention in context of Influencer marketing
Attitude
Another part of an individual’s attitude is their tendency to find something “good” or “bad.” A person’s tendency to find an attitude object comes about as a result of experience with an attitude object”. When an object is assessed, attitudes are formed. Attitudes are a part of cognitive learning. Attitudes are also affective. Attitudes are formed when things and feelings are connected; over time, these connections become stronger. (Smith A. N., 2008). In an exploratory study of customer perception and impact of relationship marketing, Jones (2015) found that 70% of respondents had a positive opinion of relationship marketing. When relationship marketing is used, the approach has a positive impact on customer reactions.
H2: Attitude positively affects Purchase intention in context of influencer marketing
H2a: Gender moderates the relationship between attitude and Purchase intention in context of Influencer marketing
H2b: Household Income moderates the relationship between attitude and Purchase intention in context of Influencer marketing
H2c: Employment moderates the relationship between attitude and Purchase intention in context of Influencer marketing”
Likability
What is Likability? Likability is the perception that the recipient of the information has of the information source’s looks and personality. (Stuart, 2014).” One of the most powerful influences on a consumer’s attitude toward a social media influencer (SMI) is how they perceive them (Li, 2012). If consumers believe that SMIs and they have similar personalities, this will encourage them to buy the same products that SMIs have posted on their social media accounts and use in their daily lives. A well-known SMI is therefore viewed as a more likeable person, which will have a larger impact on customer product selections (Uzunoğlu, 2014).
Taillon (2020) found that social media influencers’ attractiveness and likability had a positive effect on perceptions of influencers, word of mouth behavior, and purchase intent. Both the effect of beauty on intent to purchase and the effect of likability on attitudes towards influencers were positively impacted by proximity.
H3: Likability positively affects Purchase intention in context of influencer marketing
H3a: Gender moderates the relationship between likability and Purchase intention in context of Influencer marketing
H3b: Household Income moderates the relationship between likability and Purchase intention in context of Influencer marketing
H3c: Employment moderates the relationship between likability and Purchase intention in context of Influencer marketing
Knowledge
Scholars have defined knowledge in a variety of ways, including the following: In the mind of the knower, knowledge is a combination of experience, pertinent information, and professional insight”. It is a framework for evaluating and assimilating new occurrences and information. A scale was created to gauge how much consumers knew about the brand or product that was the subject of the marketing campaign (Flynn, 1999). The brand and the ambassador must make sense together in order for them to gain the trust of customers (Till, 2000). Analysis has revealed that knowledge is a crucial component of credibility to look at in order to make this match (McGinnies, 1980;Wen, 2009).
According to a research by till, (2000), celebrity athletes who are knowledgeable about sports are more convincing and successful at endorsing energy bars than other celebrities. Therefore, it is widely accepted that a celebrity perceived as competent will be more appealing than someone perceived as inexperienced (Ohanian, 1990; Erdogan, 1999) Influencers post content about brands and products on social media that their followers often see, using their expertise and experience, making the brands and products’ content appear more credible and credible than paid sponsorship ads (Kassoway, 2014).
H4: Knowledge positively affects Purchase intention in context of influencer marketing
H4a: Gender moderates the relationship between knowledge and Purchase intention in context of Influencer marketing
H4b: Household Income moderates the relationship between knowledge and Purchase intention in context of Influencer marketing
H4c: Employment moderates the relationship between knowledge and Purchase intention in context of Influencer marketing
Homophily
According to Eyal, (2003) homophily is: “the degree to which people who interact are similar in beliefs, education, social status, and the like”. People who are similar have higher levels of attraction, trust and comprehension than people who are different (Ruef, 2004)”. In other words, resemblance fosters a sense of community. This suggests that a large portion of a contagious process may be accounted for by homophily. Aral, (2009)”. According to some academics, homophily is a precondition for para-social interactions (PSI). The interaction between media consumers and media celebrities is explained by PSI (Frederick, 2012)
Micro influencers are likely to have more in common with the average consumer than a macro influencer. Generally speaking, a micro influencer is seen as more personal and close to their audience. Their life may be similar to that of other people of their age. For example, the lifestyle of a well-known macro influencer may seem glamorous and extreme in comparison to a normal lifestyle of a micro influencer. “Micro influencers are more likely to appeal to the audience that listens to them. (Kuster,2017)
H5: Homophily positively affects Purchase intention in context of influencer marketing
H5a: Gender moderates the relationship between Homophily and Purchase intention in context of Influencer marketing
H5b: Household Income moderates the relationship between Homophily and Purchase intention in context of Influencer marketing
H5c: Employment moderates the relationship between Homophily and Purchase intention in context of Influencer marketing
Purchase intention
Understanding the target audience and their intended purchases is the first stage in developing a marketing communication plan (Smith J. T., 2004)”. Purchase intention serves as a proxy for real purchasing behavior and is used to assess customer behavior (Kim, 2008). Three fundamental issues need to be addressed before any marketing campaign can be launched. Among them is: Who is the buyer? Why do consumers purchase a certain product? What do they purchase, how do they purchase it, when and where do they purchase it? (Smith J. T., 2004). The commitment to buy is a type of resolve that looks at the motivations of consumers to purchase a particular brand of goods. Factors like being ready to buy a product and anticipating buying a product make it easier for people to have a range of buying intentions.
According to Che, (2017), purchase intention is the intention to make a purchase in the near future. According to this theory, behavior is motivated and influenced by a person’s purpose, which also describes how much effort they put into carrying out the behavior. Kotler, (1994) asserts that there are five steps in the decision-making process for consumers: identifying needs, comprehending items and related information, assessing and contrasting products from various brands, buying products, and assessing them in use. When making judgements about purchases or creating intents to make purchases, consumers consider the opinions of influencers as a reference source.
Objectives of the study
- To find out the factors that influence purchase intention in context of influencer marketing.
- To assess how demographic variables, moderate the relationship between factors influencing purchase intention in influencer marketing and purchase intention.
Research Methodology
The study adopted a descriptive research approach. The current study attempts to understand characteristics of purchasers who follow influencers.
Quantitative research method was used to formulate hypotheses, and extrapolate findings to larger populations. The sample size collected for the research is 100.
Convenience Sampling technique was used as there is no sampling frame available for people following influencers. Data was analyzed with help of IBM SPSS software using tools such as ANOVA, factor analysis Regression Chi-Square Test and data visualization.
Research Gap
While this study examines an influencer, a relatively new notion, the focus is only in the city of Bengaluru i.e. in India. Several studies that are conducted on influencer marketing are qualitative in nature i.e based on focus groups and interview methods. (Chopra, 2015), (Hudders, 2022) and our study is quantitative in nature, also all recent studies on influencer marketing focused on a single social media networks like Instagram, YouTube, Facebook etc., but our study is across all channels of influencer marketing.
Conceptual Framework
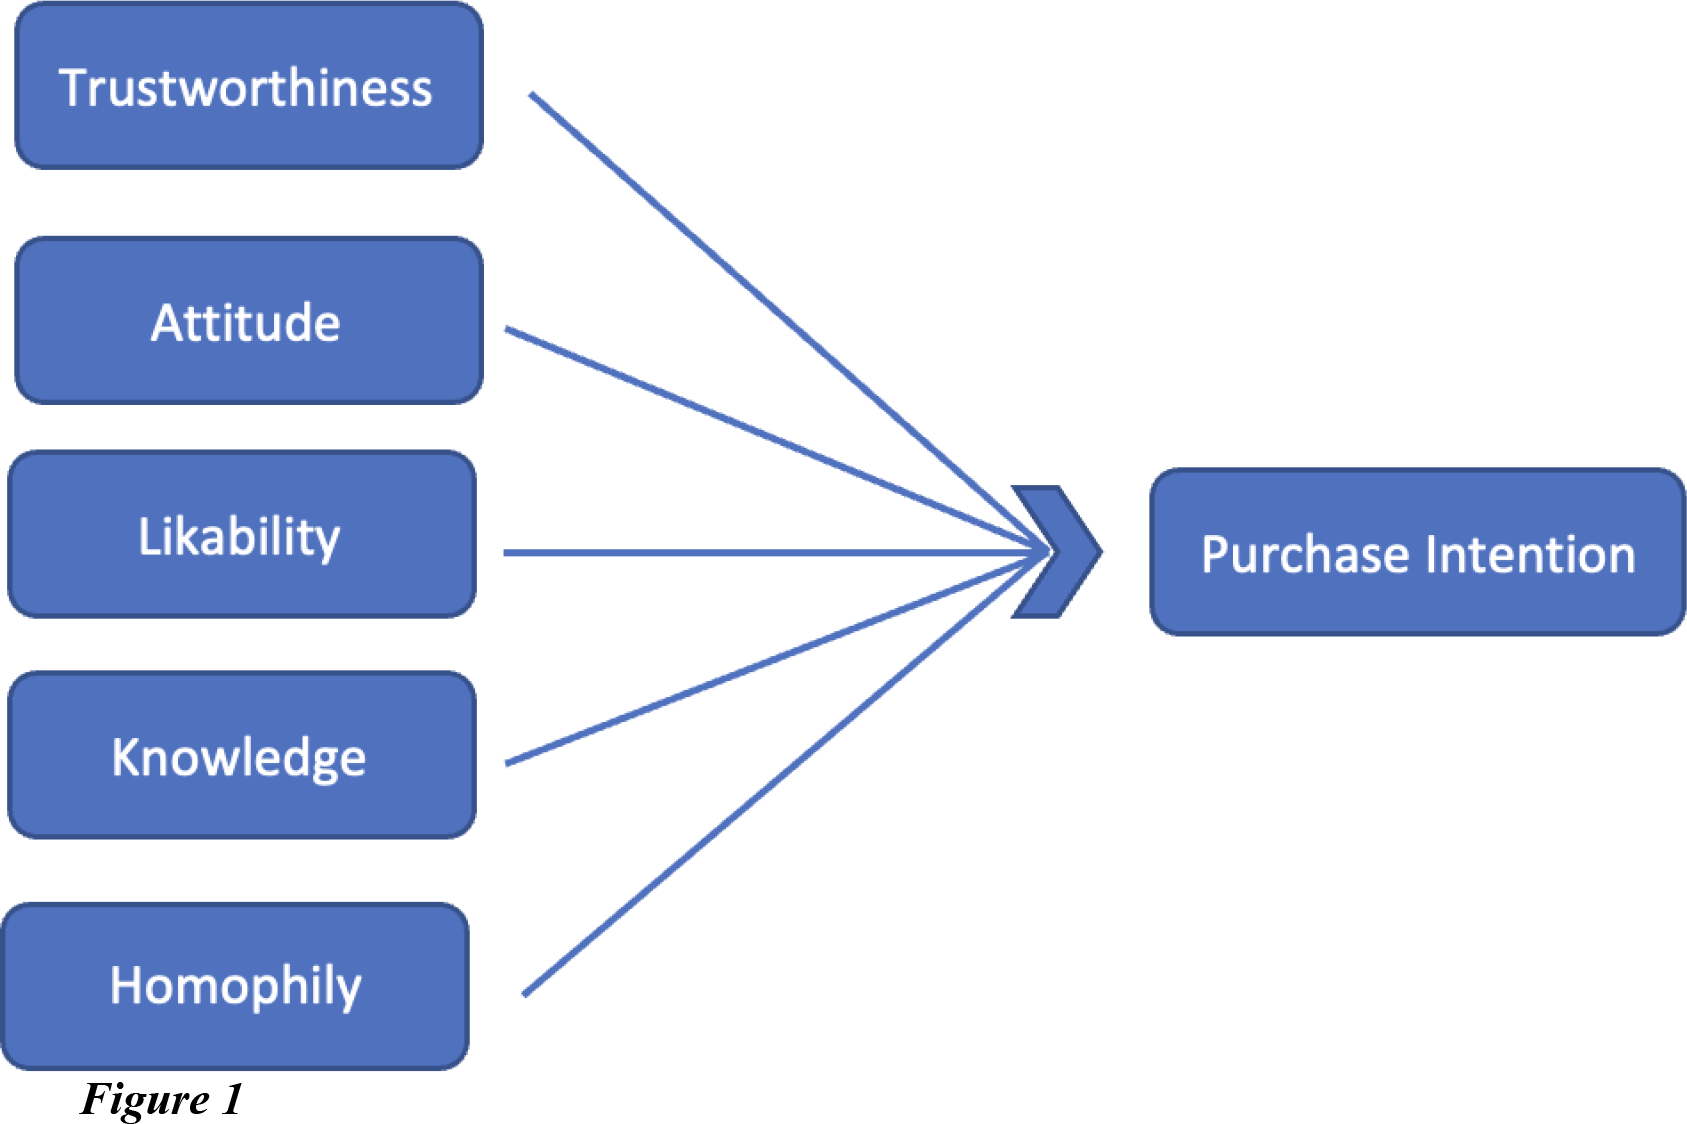
Data Analysis
The statistical method of analysis (SPSS) was used for the analysis of the data collected. The descriptive statistics such as mean and standard deviation were calculated.
Descriptive Statistics
The average, or mean, as most people refer to it. It is determined by multiplying the total number of observations by the sum of the data’s values. The standard deviation is the difference between the average value of each data point in the data set and the mean value of the data set. A standard deviation is one less than the number of values in the data set. The standard deviation is calculated by dividing the sum of the squares of all numbers by the mean value (squared) (B Conner, 2017). In the below table we can see that Homophily has the highestmean (2.4207) and Trustworthiness has the highest Standard deviation (0.8607).
Table I: Descriptive Statistics
| Sl.No | Construct | Mean | Standard Deviation |
|---|---|---|---|
| 1 | Trustworthiness | 2.3654 | .86807 |
| 2 | Attitude | 2.3365 | .79499 |
| 3 | Likability | 2.3534 | .73290 |
| 4 | Knowledge | 2.3149 | .78595 |
| 5 | Homophily | 2.4207 | .78595 |
| 6 | Purchase Intention | 2.2452 | .81846 |
Reliability Test- Cronbach Alpha
The alpha statistic was first developed by Lee Cronbach in 1951 as a way to measure internal consistency. The alpha statistic is a number from 0 to 1. Internal consistency is the degree to which all test items evaluate the same idea or construct. It is related to the degree to which the test items relate to each other (Tavakol, 2011)
Table II: “Reliability Test- Cronbach Alpha”
| Sl.No | Construct | “Cronbach’s Alpha” |
|---|---|---|
| 1 | Trustworthiness | .856 |
| 2 | Attitude | .796 |
| 3 | Likability | .796 |
| 4 | Knowledge | .845 |
| 5 | Homophily | .869 |
| 6 | Purchase Intention | .893 |
The normal range for Cronbach’s alpha reliability coefficient is between 0 and 1. However, the coefficient does not actually have a limit. The internal coherence of the scale’s components is inversely proportional to the closeness of Cronbach’s alpha to 1.0. (Tavakol, 2011).
In this study all the five variables i.e. Trust, Attitude, Likability, Homophily, Knowledge and Purchase intention have a Cronbach alpha >0.7 which proves that the variables are acceptable for the study.
1.1 Linear Regression
The main purpose of univariate regression is to look at the relationship between the dependent variable and the single independent variable, and to form a linear relationship. R2 and “adjusted” R2 are both stated in SPSS. These two numbers are frequently fairly similar in cases where the sample size is big. There may be a difference for small values of n since the figure is modified to account for the short sample size and the number of explanatory factors.
The model’s parameters are estimates based on a distribution of potential values created by SPSS; the actual value of each parameter may lie anywhere in this distribution. The spread of this distribution is depicted by the standard error of the estimate, and the Sig. column indicates whether or not these values deviate statistically from zero.
The real value falls inside a distribution that contains zero within the 95% confidence intervals if these values are not statistically different from zero. If the parameter estimate is 0, there may be no relationship at all, resulting in a zero coefficient and a flat line of best fit.
P-value >0.05 indicates non-statistical significance (SIG column) and p-value <0.05 indicates statistically significant parameter and relationship between variables.
Regression Results
Table III: H1- Trustworthiness positively affects Purchase intention
| Sr. No. | Construct | R-square | Adjusted R Square | F change | Sig.F change | Standardized Coefficients Beta | Sig. |
|---|---|---|---|---|---|---|---|
| H1 | Trustworthiness positively affects Purchase intention | .549 | .545 | 124.398 | .000 | .741 | .000 |
Table IV: Trustworthiness- Model Summary
| Model | R | R Square | Adjusted R Square | Std. Error of the Estimate |
|---|---|---|---|---|
| H1 | .741a | .549 | .545 | .55205 |
| H1a | .742b | .550 | .541 | .55434 |
| H1b | .742c | .550 | .537 | .55699 |
| H1c | .758d | .574 | .557 | .54468 |
a. Predictors: (Constant), Trustworthiness
b. Predictors: (Constant), Trustworthiness, Gender
c. Predictors: (Constant), Trustworthiness, Gender, Household Income
d. Predictors: (Constant), Trustworthiness, Gender, Household Income, Employment”
We can see that the sig. is less than 0.05 therefore we can interpret that they are significantto the study and that there is relationship between the variables.
The predictive power of the model improved from .549 – .574 with the addition of moderating variable of house hold and employment. Therefore, H1b and H1b are accepted.
We can see that the beta value of H1 is 0.714 and the p value is < 0.05 therefore H1 isaccepted.
Table V Trustworthiness- Coefficients
| Model | Variable | B | Std. Error | Beta | t | Sig. |
|---|---|---|---|---|---|---|
| H1 | (Constant) | .592 | .158 | 3.752 | .000 | |
| H1 | Trust | .699 | .063 | .741 | 11.153 | .000 |
| H1a | (Constant) | .538 | .208 | 2.587 | .011 | |
| H1a | Trust | .693 | .064 | .735 | 10.771 | .000 |
| H1a | Gender | .045 | .111 | .027 | .402 | .689 |
| H1b | (Constant) | .510 | .253 | 2.015 | .047 | |
| H1b | Trust | .697 | .067 | .739 | 10.386 | .000 |
| H1b | Gender | .041 | .113 | .025 | .364 | .717 |
| H1b | Household Income | .006 | .028 | .014 | .198 | .843 |
| H1c | (Constant) | .865 | .289 | 2.987 | .004 | |
| H1c | Trust | .658 | .068 | .698 | 9.731 | .000 |
| H1c | Gender | .075 | .112 | .046 | .674 | .502 |
| H1c | Household Income | -.019 | .029 | -.047 | -.637 | .525 |
| H1c | Employment | -.075 | .032 | -.167 | -2.361 | .020 |
a. Dependent Variable: Purchase Intention
Table VI: H2- Attitude positively affects Purchase intention
| Sr. No. | Construct | R-square | Adjusted R Square | F change | Sig.F change | Standardized Coefficients Beta | Sig. |
|---|---|---|---|---|---|---|---|
| H2 | Attitude positivelyaffects Purchase intention | .376 | .370 | 61.513 | .000 | .613 | .000 |
Table VII: Attitude- Model Summary
| Model | R | R Square | Adjusted R Square | Std. Error of the Estimate |
|---|---|---|---|---|
| H2 | .613a | .376 | .370 | .64959 |
| H2a | .623b | .388 | .376 | .64652 |
| H2b | .632c | .400 | .382 | .64362 |
| H2c | .670d | .448 | .426 | .62010 |
a. Predictors: (Constant), Attitude
b. Predictors: (Constant), Attitude, Gender
c. Predictors: (Constant), Attitude, Gender, Household Income
d. Predictors: (Constant), Attitude, Gender, Household Income, Employment”
We can see that the sig is less than 0.05 therefore we can interpret that they are significant to the study and that there is relationship between the variables.
The predictive power of the model improved from .376, .388, .400 to .448 with the addition themoderating variable of gender, household income and employment. Therefore, H2a, H2b and H2c are accepted.
We can see that the beta value of H2 is 0.613 and the p value is < 0.05 therefore H2 is accepted.
Additional Regression Results
Table VIII: Attitude- Coefficients
| Model | Variable | B | Std. Error | Beta | t | Sig. |
|---|---|---|---|---|---|---|
| H2 | (Constant) | .770 | .199 | 3.876 | .000 | |
| H2 | Attitude | .631 | .081 | .613 | 7.843 | .000 |
| H2a | (Constant) | .533 | .260 | 2.051 | .043 | |
| H2a | Attitude | .618 | .081 | .600 | 7.651 | .000 |
| H2a | Gender | .179 | .128 | .110 | 1.404 | .164 |
| H2b | (Constant) | .732 | .296 | 2.473 | .015 | |
| H2b | Attitude | .604 | .081 | .587 | 7.462 | .000 |
| H2b | Gender | .200 | .128 | .123 | 1.559 | .122 |
| H2b | Household Income | -.044 | .032 | -.109 | -1.384 | .170 |
| H2c | (Constant) | 1.200 | .326 | 3.679 | .000 | |
| H2c | Attitude | .563 | .079 | .547 | 7.102 | .000 |
| H2c | Gender | .234 | .124 | .144 | 1.887 | .062 |
| H2c | Household Income | -.074 | .032 | -.183 | -2.298 | .024 |
| H2c | Employment | -.105 | .035 | -.235 | -2.955 | .004 |
a. Dependent Variable: Purchase Intention
Table IX: H3- Likability positively affects Purchase intention
| Sr. No. | Construct | R-Square | Adjusted R Square | F change | Sig.F change | Standardized Coefficients Beta | Sig. |
|---|---|---|---|---|---|---|---|
| H3 | Likability positivelyaffects Purchase intention | .427 | .421 | 75.949 | .000 | .653 | .000 |
Likability- Model Summary
| Model | R | R Square | Adjusted R Square | Std. Error of the Estimate |
|---|---|---|---|---|
| H3 | .653a | .427 | .421 | .62269 |
| H3a | .684b | .468 | .457 | .60298 |
| H3b | .690c | .477 | .461 | .60096 |
| H3c | .709d | .503 | .483 | .58838 |
a. Predictors: (Constant), Likability
b. Predictors: (Constant), Likability, Gender
c. Predictors: (Constant), Likability, Gender, Household Income
d. Predictors: (Constant), Likability, Gender, Household Income, Employment”
We can see that the sig is less than 0.05 therefore we can interpret that they are significant tothe study and that there is relationship between the variables.
The predictive power of the model improved from .427, .468, .477 to .503 with the additionthe moderating variable of gender, household income and employment. Therefore, H3a, H3b and H3c are accepted.
We can see that the beta value of H3 is 0.653 and the p value is < 0.05 therefore H3 isaccepted.
Table XII: Likability- Coefficients
| Model | Variable | B | Std. Error | Beta | t | Sig. |
|---|---|---|---|---|---|---|
| H3 | (Constant) | .528 | .206 | 2.561 | .012 | |
| H3 | Likability | .730 | .084 | .653 | 8.715 | .000 |
| H3a | (Constant) | .018 | .271 | .065 | .948 | |
| H3a | Likability | .736 | .081 | .659 | 9.079 | .000 |
| H3a | Gender | .330 | .118 | .203 | 2.789 | .006 |
| H3b | (Constant) | .200 | .305 | .658 | .512 | |
| H3b | Likability | .723 | .082 | .647 | 8.864 | .000 |
| H3b | Gender | .345 | .118 | .212 | 2.911 | .004 |
| H3b | Household Income | -.038 | .030 | -.095 | -1.296 | .198 |
| H3c | (Constant) | .608 | .347 | 1.753 | .083 | |
| H3c | Likability | .675 | .082 | .604 | 8.184 | .000 |
| H3c | Gender | .363 | .116 | .223 | 3.121 | .002 |
| H3c | Household Income | -.062 | .031 | -.153 | -2.012 | .047 |
| H3c | Employment | -.079 | .034 | -.177 | -2.307 | .023 |
a. Dependent Variable: Purchase Intention
Knowledge and Homophily Regression Results
Table XII: H4- Knowledge positively affects Purchase intention
| Sr. No. | Construct | R-square | Adjusted R Square | F change | Sig.F change | Standardized Coefficients Beta | Sig. |
|---|---|---|---|---|---|---|---|
| H4 | Knowledge positively affects Purchase intention | .526 | .521 | 112.985 | .000 | .725 | .000 |
Table XIII: Knowledge- Model Summary
| Model | R | R Square | Adjusted R Square | Std. Error of the Estimate |
|---|---|---|---|---|
| H4 | .725a | .526 | .521 | .56652 |
| H4a | .740b | .548 | .539 | .55570 |
| H4b | .746c | .557 | .543 | .55315 |
| H4c | .752d | .566 | .548 | .55029 |
a. Predictors: (Constant), Knowledge
b. Predictors: (Constant), Knowledge, Gender
c. Predictors: (Constant), Knowledge, Gender, Household Income
d. Predictors: (Constant), Knowledge, Gender, Household Income, Employment”
We can see that the sig is less than 0.05 therefore we can interpret that they are significantto the study and that there is relationship between the variables.
The predictive power of the model improved from .526, .548, .557 to .566 with the additionthe moderating variable of gender, household income and employment. Therefore, H4a, H4b and H4c are accepted.
We can see that the beta value of H4 is 0.725 and the p value is < 0.05 therefore H4 isaccepted.
Table XIV: Knowledge- Coefficients
| Model | Variable | B | Std. Error | Beta | t | Sig. |
|---|---|---|---|---|---|---|
| H4 | (Constant) | .498 | .174 | 2.867 | .005 | |
| H4 | Knowledge | .755 | .071 | .725 | 10.629 | .000 |
| H4a | (Constant) | .148 | .231 | .641 | .523 | |
| H4a | Knowledge | .748 | .070 | .718 | 10.722 | .000 |
| H4a | Gender | .244 | .109 | .150 | 2.238 | .027 |
| H4b | (Constant) | .322 | .262 | 1.229 | .222 | |
| H4b | Knowledge | .736 | .070 | .707 | 10.525 | .000 |
| H4b | Gender | .260 | .109 | .160 | 2.383 | .019 |
| H4b | Household Income | -.038 | .027 | -.094 | -1.391 | .167 |
| H4c | (Constant) | .572 | .314 | 1.823 | .071 | |
| H4c | Knowledge | .702 | .074 | .674 | 9.526 | .000 |
| H4c | Gender | .275 | .109 | .169 | 2.518 | .013 |
| H4c | Household Income | -.052 | .029 | -.129 | -1.805 | .074 |
| H4c | Employment | -.047 | .033 | -.105 | -1.429 | .156 |
a. Dependent Variable: Purchase Intention
Table XV: H5- Homophily positively affects Purchase intention
| Sr. No. | Construct | R-Square | Adjusted R Square | F change | Sig.F change | Standardized Coefficients Beta | Sig. |
|---|---|---|---|---|---|---|---|
| H5 | Homophily positively affects Purchase intention | .588 | .584 | 145.573 | .000 | .767 | .000 |
Table XVI: Homophily- Model Summary
| Model | R | R Square | Adjusted R Square | Std. Error of the Estimate |
|---|---|---|---|---|
| H5 | .767a | .588 | .584 | .52792 |
| H5a | .770b | .594 | .586 | .52690 |
| H5b | .771c | .595 | .583 | .52883 |
| H5c | .783d | .613 | .597 | .51954 |
a. Predictors: (Constant), Homophily
b. Predictors: (Constant), Homophily, Gender
c. Predictors: (Constant), Homophily, Gender, Household Income
e. Predictors: (Constant), Homophily, Gender, Household Income, Employment”
We can see that the sig is less than 0.05 therefore we can interpret that they are significant to the study and that there is relationship between the variables. The predictive power of the model improved from .588, .594, .595 to .613 with the addition the moderating variable of gender, household income and employment. Therefore, H5a, H5b and H5c are accepted. We can see that the beta value of H5 is 0.767 and the p value is < 0.05 therefore H5 isaccepted.
Table XVII: Homophily- Coefficients
| Model | Variable | B | Std. Error | Beta | t | Sig. |
|---|---|---|---|---|---|---|
| H5 | (Constant) | .494 | .154 | 3.207 | .002 | |
| H5 | Homophily | .723 | .060 | .767 | 12.065 | .000 |
| H5a | (Constant) | .334 | .205 | 1.627 | .107 | |
| H5a | Homophily | .713 | .060 | .756 | 11.799 | .000 |
| H5a | Gender | .123 | .104 | .076 | 1.180 | .241 |
| H5b | (Constant) | .261 | .250 | 1.044 | .299 | |
| H5b | Homophily | .722 | .063 | .766 | 11.428 | .000 |
| H5b | Gender | .115 | .106 | .071 | 1.089 | .279 |
| H5b | Household Income | .014 | .027 | .034 | .517 | .607 |
| H5c | (Constant) | .585 | .288 | 2.030 | .045 | |
| H5c | Homophily | .686 | .064 | .728 | 10.671 | .000 |
| H5c | Gender | .142 | .105 | .087 | 1.353 | .179 |
| H5c | Household Income | -.008 | .028 | -.019 | -.278 | .782 |
| H5c | Employment | -.065 | .030 | -.146 | -2.146 | .034 |
a. Dependent Variable: Purchase Intention
Findings
Here we can see that our independent variables Trustworthiness (0.000), Attitude (0.000), Likability (0.000), Knowledge (0.000) and Homophily (0.000) are < p value 0.05 They can be interpreted as meaning that they are relevant for the study and there is a correlation between the variables.
This study proves how influencers affect the purchase decision of consumers on different aspects i.e., For trustworthiness the beta value was 0.714 and the p value is < 0.05 proves the variable had a significant effect on the study and also the models predictive power improved from .549 – .574 with the addition of moderating variable of house hold and employment.
For attitude the beta value is 0.613 and the p value is < 0.05 proves the variable had a significant effect on the study and also the models predictive power improved from .376, .388, .400 to.448 with the addition the moderating variable of gender, house hold income employment.
For likability the beta value is 0.653 and the p value is < 0.05 proves the variable had a significant effect on the study and also the models predictive power improved .427, .468, .477 to .503 with the addition the moderating variable of gender, household income and employment.
For knowledge the beta value is 0.725 and the p value is < 0.05 proves the variable had a significant effect on the study and also the models predictive power improved .526, .548, .557 to .566 with the addition the moderating variable of gender, household income and employment.
For homophily the beta value is 0.767 and the p value is < 0.05 proves the variable had a significant effect on the study and also the models predictive power improved .588, .594, .595 to .613 with the addition the moderating variable of gender, household income and employment.
Limitations of the study
The scope of this study is restricted to the city of Bengaluru in India. and these findings can’t be applied to the entire universe, the generalizability of the study’s findings may be constrained by the sample size, which is about 100, which may not be sufficient to adequately reflect the population of interest, for the study I’ve taken a sample of respondents of all ages and not a specific age group or generation to be specific.
Contribution to literature
From my study we can say that how the independent variables, such as trustworthiness, homophily, attitude, likability and knowledge have a significant effect on the purchase decisions of consumers where in homophily had the highest beta value and had a great effect on purchase decision. Also, how demographic variables i.e., household income, gender and employment moderate the relationship between the independent variables and dependent variables.
Future research
For future research on this topic, researchers can conduct study in the same quantitative sense in difference generations, and what independent variables affect their purchase decision, also keeping in mind in this era how sportsperson, musicians, models, actors are overlooked because of this meteoric rise of social media influencers.
Conclusion
Influencers are independent third parties who use blogs, Twitter, and other forms of social media to shape public opinion in the age of the Internet., by engaging in activities that allow them to voice their opinions, such as writing product evaluations, making how-to videos, running contests, and sharing pictures of goods or services. The purpose of this study was to understand how this new marketing trend of influencer marketing is being an effective marketing technique for marketers in recent times. As it brought to our notice how these different independent variables of Influencers have an impact on the purchase decision among consumers. This paper indicated how important influencer marketing is and how companies need to focus on this effective and efficient marketing technique. The independent variable homophily had the highest beta value of 0.767 which had a great effect on purchase intention. Therefore, marketers need to market their product via influencer which consumers can associate to on different aspects like traits, values, personality, lifestyle etc. Marketers have to focus on micro influencers as they are more intimate and close to their followers than macro influencers who might seem very unrelated as compared to a normal life. Household income gender and employment moderates the relationship of the independent variable Trustworthiness, Attitude, Likability, Knowledge and Homophily and the dependent variable Purchase Intention, which will help marketers to focus on these demographic aspects of their target audience.
Managerial Implication
Influencer marketing helps marketers to reach a huge target audience which helps them to position their product at good cost rate as compared to other forms of marketing techniques which are rising day by day. Lead generation has changed dramatically in recent years due to the rapid growth of social media as a way to connect businesses with consumers. It helps big brands attract more customers and small businesses grow by raising their visibility, i.e. it provides a higher ROI than any other marketing channel. Social media allows customers to express their interest in a brand and the products and services offered by that brand on a platform that is easily accessible. With the concept of the right product to the right consumer marketers also need to choose which influencer is a good fit for the target audience their Catering, this will help marketers to get good conversion rates for their businesses. With the help of this study marketers can choose influencers with whom consumers closely associate with, who have good knowledge about their product, who have a good attitude towards their followers and also who are likable and are have trustworthy traits.
References
Brown, D. H. (2008). Influencer marketing: Who really influences your customers? Elsevier/Butterworth-Heinemann.
Insights, S. (2017). Smart Insights. Retrieved from Key influencer marketing trends for 2017: . http://www.smartinsights.com/online-pr/influencer-marketing/keyinfluencer-marketing-trends-2017/
Subramanian, S. S. (1995). Reference group influence on innovation adoption behaviour: Incorporating comparative and normative referents. European Advances in Consumer Research.
M. Glucksman, “The Rise of Social Media Influencer Marketing on Lifestyle Branding : A Case Study of Lucie Fink I. Introduction II. Literature Review,” Elon Journal of Undergraduate Research in Communications, 2017.
De Veirman, M. C. (2017). Marketing through Instagram influencers: The impact of number of followers and product divergence on brand attitude. International Journal of Advertising. 36, 798-828.
Verma, V. (2022, July 23). How Indian brands are rooting for influencer marketing in 2022. Retrieved from Times Of India: https://timesofindia.indiatimes.com/blogs/voices/how-indian-brands-are-rooting-for-influencer-marketing-in-2022/
Biaudet, S. (2017). Influencer Marketing as a Marketing Tool. International Business.
Kalu, F.(2019). The Impact of Social Media Influencer Marketing On Purchase Intention from An Irish Male Millennial’s Perception: A case study of Irish Fashion Industry. Masters thesis, Dublin, National College of Ireland.
Isosuo, H. (2016). Social media influencer marketing. Bachelor’s Thesis Degree Programme in International Business. JAMK University of Applied Sciences.
Kassoway, A. (2014). Social Influence, Marketing’s new frontier. https://ivetriedthat.com/wp-content/uploads/2015/02/Social_Influence_Research_Paper.pdf
Min Xiao, R. W.-O. (2018). Factors affecting YouTube influencer marketing credibility: a heuristic-systematic model. Journal of Media Business Studies.15(3), 188-213.
Ohanian, R. (1990). Construction and validation of a scale to measure celebrity endorsers. Journal of Advertising.19(3), 39-52.
Reysen, S. (2005). Construction of a new scale: The Reysen likability scale. Social Behavior and Personality: An International Journal.33(2), 201-208
Flynn, L. R. (1999). A short, reliable measure of subjective knowledge. Journal of Business Research.46(1), 57-66.
McCroskey, J. C. (1975). The Development of a Measure of Perceived Homophily In Interpersonal Communication. Human Communication Research. 1(4), 323-332.
Hootsuite. (2019). Digital Marketing Report. Hootsuite.
Lim, X. J., Rozaini, A., Radzol, M., Cheah, J.-H., & Wong, M. W. (2017). The Impact of Social Media Influencers on Purchase Intention and the Mediation Effect of Customer Attitude. Asian Journal of Business Research, 7(2), 19+.
Chi, H. Y. (2011). The influences of perceived value on consumer purchase intention: the moderating effect of advertising endorser. Journal of International Management Studies.
Hovland, C. I. (1953). Communication and Per- suasion, New Haven, CT. Yale University Press.
Smith, A. N. (2008). Attitudes. In Clegg, S. R. & Bailey, J. R. (Eds). International Encyclopedia of Organisation Studies. Thousand Oaks: SAGE Publications inc.
Shasha et al., (2014). Examining the antecedents of persuasive eWOM messages in social media. Online Information Review. 38(6), 746-768.
Li, Y. M. (2012). Online social advertising via influential endorsers. International Journal of Electronic Commerce.16(3), 119-153.
Uzunoğlu, E. &. (2014). Brand communication through digital influencers: Leveraging blogger engagement. International Journal of Information Management. 34(5), 592-602.
Turner, J. R. (1993). Interpersonal and psychological predictors of parasocial interaction withdifferent television performers. Communication Quarterly. 41(4), 443-453.
Siegel, S. (2021). The Contents of Perception. The Stanford Encyclopedia of Philosophy (Fall 2021 Edition).
John Simon E. Abraham1, S. J. (2022). Consumer Perception on Influencer Marketing Efforts of Brands in the Beauty and Cosmetics Industry. International Journal Of Social And Management Studies. 3(2), 105-118.
Shepherd, J. (2022). Essential Influencer Marketing Statistics You Need to Know in 2022. Social Shepherd.
Jones, M. A. (2015). Exploring consumers’ attitude towards relationship marketing. Journal of Services Marketing, 29(3), 188-199.
Miller, G. R. (1969). Source trustworthiness, opinionated statements, and response to persuasive communication. 1-7.
Forbes. (2018). How and why does consumer behavior change? Forbes.
Geyser, W. (2022, July 27). What is an Influencer? – Social Media Influencers Defined . Retrieved from Influencer marketing hub: https://influencermarketinghub.com/what-is-an-influencer/
Eyal, K. &. (2003). Viewer Aggression and Homophily, Identification, and Parasocial Relationships With Television Characters. Journal of Broadcasting & Electronic Media, 77–98.
Ruef, M. A. (2004). The Structure of Founding Teams: Homophily, Strong Ties, and Isolation among U.S. Entrepreneurs. American Sociological Review.68(2), 195-222.
Aral, S. M. (2009). Distinguishing influence-based contagion from homophily-driven diffusion in dynamic networks. Proceedings of the National Academy of Sciences of the United States of America, 106(51), 21544–9.
Frederick, E. L. (2012). Why We Follow: An Examination of Parasocial Interaction and Fan Motivations for Following Athlete Archetypes on Twitter. International Journal of Sport Communication, 5(4), 481–502.
Kuster, E. N. (2017). Social influencers: examining source credibility and homophily on Instagram . Master’s thesis, University of Twente, 14-15.
L Hudders, S. D. (2022). Gender effects in influencer marketing: an experimental study on the efficacy of endorsements by same-vs. other-gender social media influencers on Instagram. International Journal of Advertising, 3.
Tomoson. (2015). Influencer Marketing Study. Retrieved from tomoson: http://blog.tomoson.com/
Zeithaml, V. A. (1981). How Consumer Evaluation Processes Differ for Products and Services. American Marketing Association First Services Marketing Conference.
Crosby, L. A. (1990). Relationship Quality in Services Selling: An Interpersonal Influence Perspective. Journal of Marketing, 54(3), 68–81.
Do Yuon Kima, H.-Y. K. (2021). Trust me, trust me not: A nuanced view of influencer marketing on social media. Journal of Business Research. 134, 223-232.
BD till, M. B. (2000). The match-up hypothesis: Physical attractiveness, expertise, and the role of fit on brand attitude, purchase intent and brand beliefs. Journal of advertising, 1-13.
Wen, C. T. (2009). Advertising Effectiveness on Social Network Sites: An Investigation of Tie Strength, Endorser Expertise and Product Type on Consumer Purchase Intention. ICIS 2009 Proceedings, 151.
Till, B. B. (2000). The Match-Up Hypothesis: Physical Attractiveness, Expertise, and the Role of Fit on Brand Attitude, Purchase Intent and Brand Beliefs. Journal of Advertising, 29(3), pp. 1-13.
Erdogan, B. Z. (1999). Celebrity Endorsement: A Literature Review. Journal of Marketing Management, 15(4). 291-314.
Che, J. W. (2017). onsumer Purchase Decision in Instagram Stores: The Role of Consumer Trust. HICSS, 24-33.
P. Kotler, G. A. (1994). Principles of Marketing. Englewood Cliffs: NJ Prentice hall.
Taillon, B. J. (2020). Understanding the relationships between social media influencers and their followers: The moderating role of closeness. Journal of Product & Brand Management, 767–782.
Van der Waldt, D. L. (2009). Celebrity endorsements versus created spokespersons in advertising: A survey among students. South African Journal of Economic and Management Sciences, 12(1), 100-114.
Kim, D. J. (2008). A trust-based consumer decision-making model in electronic commerce: The role of trust, perceived risk, and their antecedents. Decision Support Systems, 44(2), 544-564.
Rebelo, M. F. (2017). How Influencers’ Credibility on Instagram is perceived by consumers and its impact on purchase intention. Doctoral dissertation.
AGENCY, I. M. (2022, April 22). Top Indian Influencers. Retrieved from Hire Influence: https://hireinfluence.com/blog/top-indian-influencers/
George, D. &. (2003). SPSS for Windows step by step: A simple guide and reference. Boston: Allyn & Bacon, 231.
Gülden Kayan Uyanıka, N. G. (2013). A Study on Multiple Linear Regression Analysis. Procedia – Social and Behavioral Sciences.
B Conner, E. J. (2017). Descriptive statistics. American Nurse Today.
Nidamarthy, D. S. (2022). Influencer Marketing: Reaching the Right Person at the Right Place. Annual Research Journal of SCMS. 8(22), 74-93.
Belanche, F. M. (2020). Followers’ reactions to influencers’ Instagram posts. Spanish Journal of Marketing-ESIC.24(1),
Chopra, V. A. (2015). Influencer Marketing: An Exploratory Study to Identify Antecedents of Consumer Behavior of Millennial.
Lou, S. Y. (2019). Influencer Marketing: How Message Value and Credibility Affect Consumer Trust of Branded. Journal of Interactive Advertising. 19(1).
McGinnies, W. C. (1980). Better Liked than Right: Trustworthiness and Expertise as Factors in Credibility. Personality and Social Psychology Bulletin, 467–472.
Smith, J. T. (2004). Marketing communications: an integrated approach. Kogan Page Publishers.
Hudders, C. L. (2022). A new era of influencer marketing: Lessons from Recent Inquires and Thoughts on Future Directions. International Journal of Advertising.41(1), 1-5.
Tavakol, R. D. (2011). Making sense of Cronbach’s alpha. International Journal of Medical Education. 2, 53-55.
Acknowledgement
This article was presented at 11th International Conference on Contemporary Issues in Management organized by International School of Management Excellence, Bangalore held on 24th and 25th February 2023